Introduction
The international conversation about social democracy is quite focused on electoral sociology: What blocks of voters support social democratic parties? Can parties craft new electoral coalitions between the working-class, public-sector workers and even professionals? Do these coalitions undermine the parties’ commitment to economic redistribution by favouring more middle-class issues?
The conversation about social democracy in Canada has had much less to say about which voting blocs or electoral coalitions the NDP is pursuing or ought to pursue. After the near complete desertion of its electorate in the 2025 election, it is crucial to ask what coalition of supporters the federal NDP has been able to attract over the past couple of decades, what challengers it faces in retaining those supporters, and what tensions exist within that coalition. We pay particular attention to working class voters. They have historically been an important voting bloc for the NDP. The supposed desertion of the working class from the NDP to the Conservatives has also been an effective trope for political opponents making the case for the NDP’s loss of relevance.
The discussion below draws on a number of recent analyses we have conducted on the relationship of socio-economic class to voting behaviour in Canada over the past half century, relying on the Canadian Election Study. We emphasize that the NDP has some cards to play to reconnect with working class voters, especially around redistribution and economic populism.
Changing Class Bases
Social democracy emerged out of labour movements, and where it has been most successful, it has relied on working class electoral mobilization. In these countries, the social democratic party could rely on winning a large plurality of the votes of workers, and indeed the largest share of its votes would come from the working class (Rennwald 2020).
We measure the working class based on occupation. Up to the 2006 election, we used the occupational categories provided by the Canadian Election Study. After 2006, we used Statistics Canada’s National Occupation Classification NOC) system which distinguishes skill levels and skill types for occupations. The working class are defined as workers in skills levels B, C, and D and occupational categories 7, 8, and 9. This combines skilled and unskilled working-class occupations such as boilermakers, ironworkers, delivery and courier drivers, and construction workers.1
Chart 1 shows that none of this applied in Canada given the long-run weakness of the NDP and its inability to disrupt the dominance of the two major parties. The NDP has never won the plurality of working-class votes – it is the Conservative party that has done so in every election over the past half century.2 All the recent talk about the Conservative party drawing working-class votes ignores that they have long done well with this electorate, although they may be further strengthening their hold.3 Cultural issues have long attracted the working class to the Conservatives, which has accelerated since the 2004 merger on the right (Polacko, Kiss, and Graefe 2022). Koop and Farney (2025) show that recent Conservative politicians have also been able to attain greater support among the working-class by employing symbolism (through framing emphasizing their own working-class roots or connections), populism, and economic nationalism.
Chart 1 – Party vote share by class for Quebec and ROC, 1965-2021
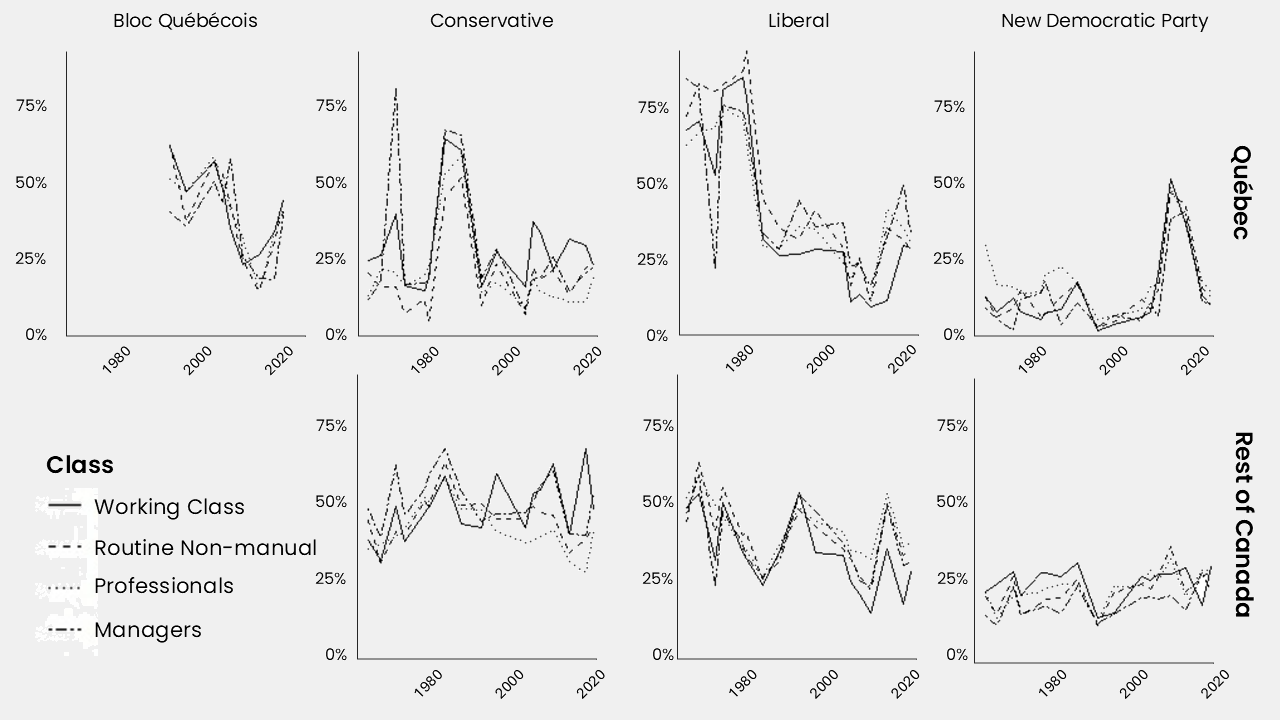
The NDP has nevertheless historically done better with the working class than with other classes, winning a higher percentage of their votes than the votes of routine non-manual workers, professionals or managers. This strength persisted at least until 2015, even after the Liberal party lost much of their working-class support in the 1990s. Nevertheless, the difference between working class support and that of professionals and routine non-manual workers is not huge, such that the NDP’s voting base can be seen as having a multiclass character.
To the extent that the NDP’s electorate has had a working-class skew, this has reflected a capacity to win a slightly larger share of the votes of unionized members than among the electorate as a whole. Daniel Westlake, Larry Savage and Jonah Butovsky (2025) capture the characteristics of this support. While the NDP at its origins had close ties to the large private sector industrial unions in the Canadian Labour Congress, it currently draws its stronger union vote from public sector union members. Westlake et al. find important gender and regional variations. Women union members differentiate themselves from union men in weaker support for the Conservatives and stronger support for the NDP. They distinguish themselves from non-union women in that their “gender gap” (i.e. their tendency to vote disproportionately for non-Conservative parties) shows as a strong vote for the NDP, rather than a stronger vote shared between the Liberals and the NDP. Regionally, the non-Conservative union vote is more strongly NDP in Western Canada, while it is split between the Liberals and the NDP in Ontario.
These findings present strategic challenges for the NDP. While social democratic parties have historically relied on the votes of the working class, the NDP has had to sustain a multiclass base. As the size of the working class is shrinking (from about 25% of the labour force to 20% over the past quarter century), the party is pushed to find support elsewhere. Many social democratic parties have attempted to add public sector workers and professionals to their electoral coalition, recognizing shared interests between pro-redistribution working class voters, professionals reliant on strong public services (health and education) for their well-being, and public sector workers for whom an activist state means job security. In other work, we observe the emergence of a small sector cleavage in Canada, where public sector workers come to vote for the NDP at slightly higher rates than the overall population (Polacko, Graefe and Kiss 2025). However, sustaining such a coalition requires political skill as it works across flashpoints, such as private-sector workers seeing public sector workers as living off their taxes and slowing wealth generation (see Westlake, Savage and Butovsky 2025). It is also complicated by the presence of the Liberal party which has also recently prioritized attracting public sectors workers and professionals into its voting base.
What Moves Working-Class Voters
Political attitudes: Economic and cultural issues
To better understand coalitional possibilities, it is useful to consider the policy preferences of working-class voters compared to the broader electorate, as well as what pushes working class voters to choose their preferred party. In terms of attitudinal preferences, Chart 2 compares the respective left-right positioning of working class and non-working class respondents on six key measures found in the literature on class realignment, which focus on immigration, the environment, moral traditionalism, and redistribution.4 Overall, we note a leftward shift from 1993 to 2021 which is quite pronounced on the cultural issues of immigration, gender equality, and LGTBQ+ rights, and more muted in the areas of redistribution, jobs vs. immigration, and jobs vs. environment. The working class has nevertheless remained slightly to the right of the general population in the areas of the environment, gender equality and LGBTQ+ rights. However, we see large differences between the working class and general population for our two immigration items, which pertain to immigration rates and perceived trade-offs between immigration and jobs. This difference of roughly 10 percentage points has largely held up over time.
Chart 2 – Mean attitudinal preferences over time for working-class versus rest of population
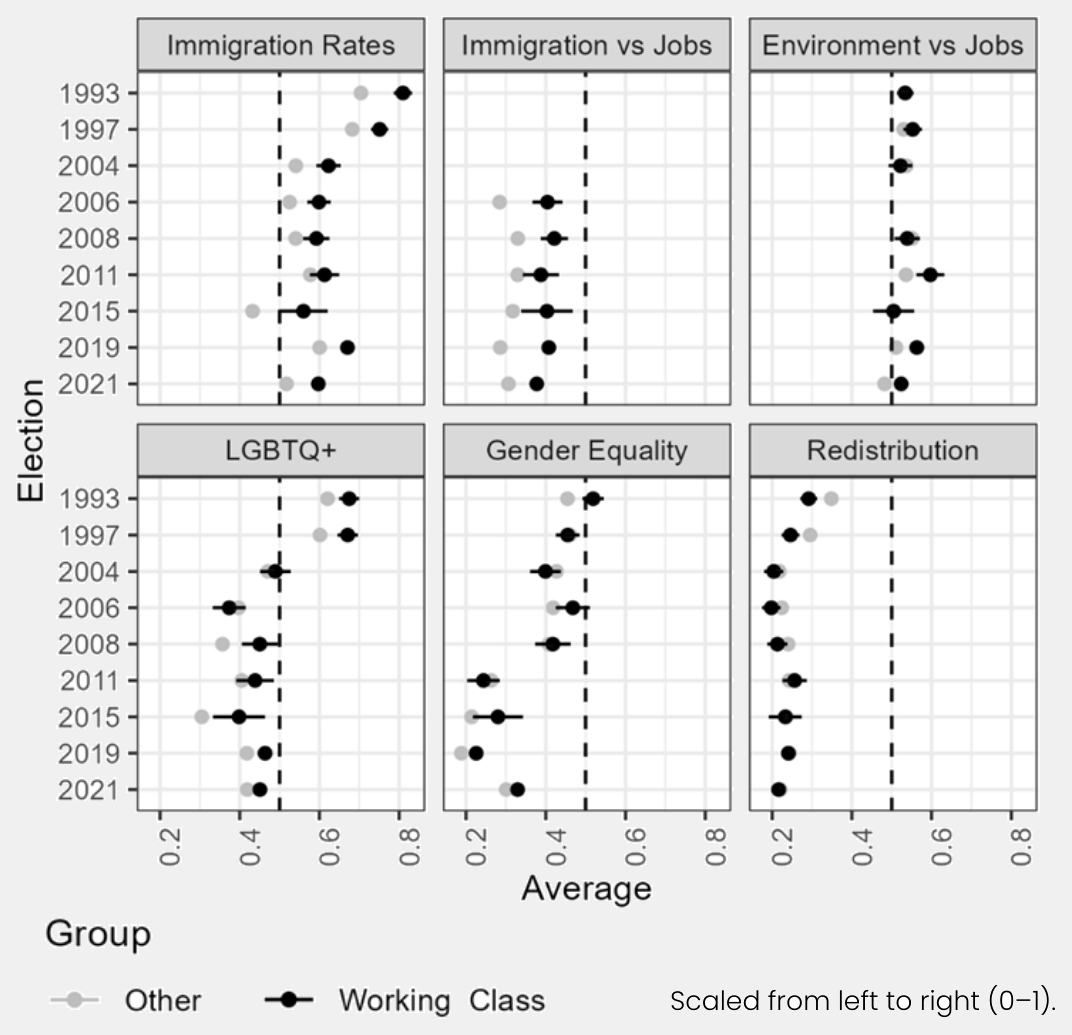
As for the economy, in the 1990s, the working class was somewhat to the right of the general population on redistribution, but has since moved leftward to a greater extent, and there is little discernible difference between the working class and general population on the issue. This is in contrast to each of the cultural issues, which show that the working class is to the right of the general population on all five issues.
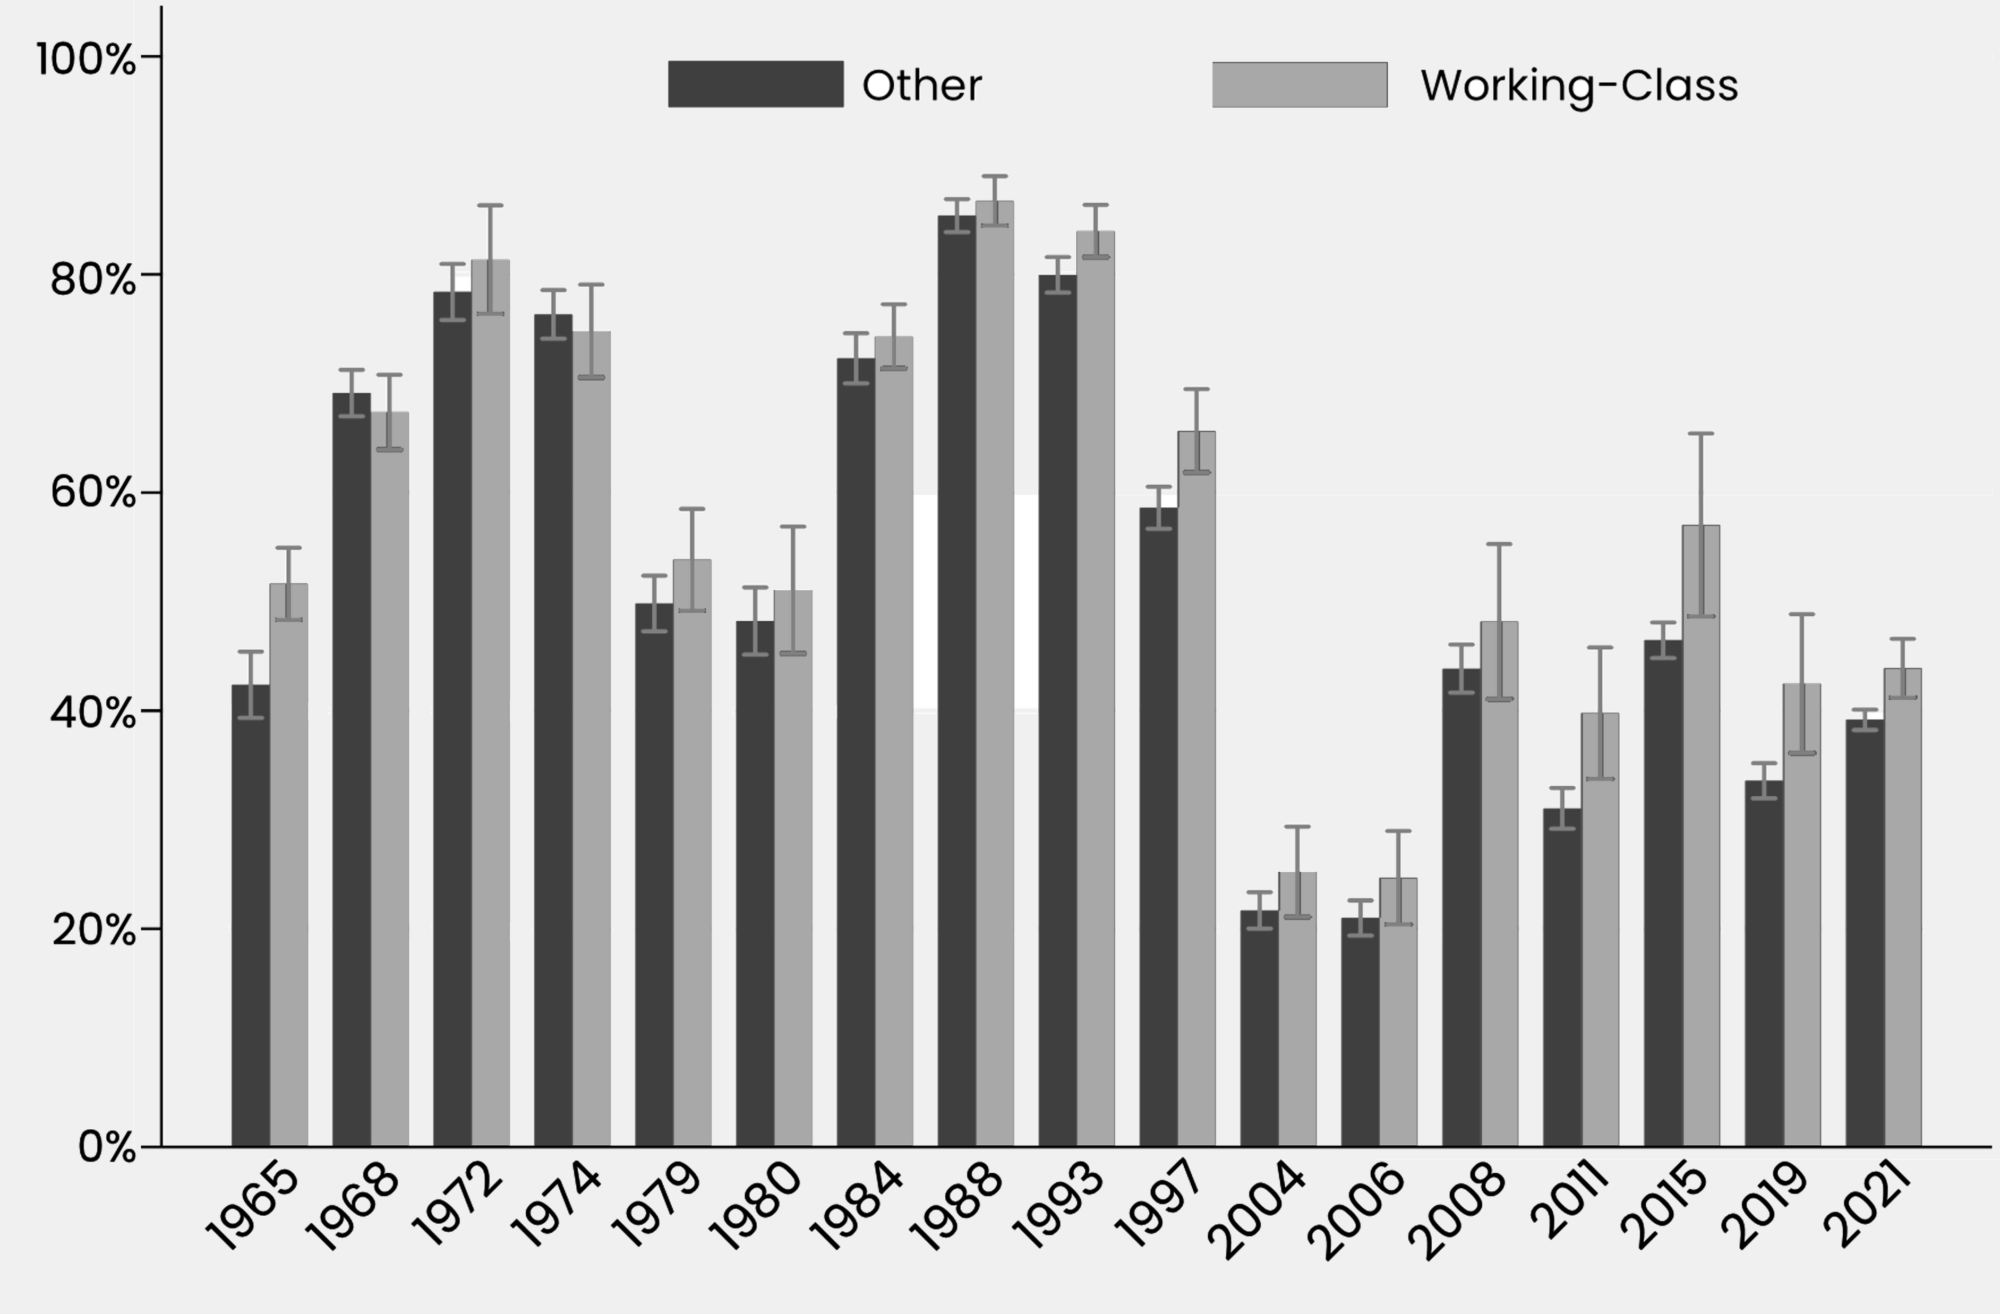
We can also measure economic preferences by examining which issue people believe is the most important problem that needs addressing in each election. For our purposes, we code the number of respondents who chose an economic issue (such as jobs, taxes, housing, inflation, free trade, etc.) as the most important problem. Chart 3 shows that this has declined since the twentieth century but still amounts to roughly 40% of respondents. This is not surprising, given the post-material shift in societal values from prioritizing basic material and physical security to emphasizing post-material needs such as autonomy, identity and self-expression (Inglehart 1977, 1990). However, when we compare the working class with the general population, we find that the working class has always been more concerned about the economy, but the gap has increased substantially since the financial crisis. This is not entirely surprising as the financial crisis disproportionately impacted the working class in the ensuing years via job losses, stagnant wages, and the erosion of household wealth (Mowad 2023). Prior to 2011, the only elections where there is a statistically significant difference between the working class and general population was in 1965 and 1997. Yet, in the four elections taking place in the decade between 2011 and 2021, we see a statistically significant difference in each one and an average difference of roughly 8.5 percentage points. So, as the working class has moved slightly leftward on redistribution over time, they have also become significantly more likely to see the economy as the most important problem to be addressed by politicians.
Chart 3 – Mean % on economy as the most important problem for working-class versus rest of population, 1965-2021
Political attitudes: Political Efficacy and Support for Democracy
Canada has been plagued by a growing cost-of-living crisis and rising inequality (Osberg 2024). This has led to economic anxiety accompanied by decreasing support for democracy (Environics Institute 2024) and satisfaction with democracy (Wike and Fetterolf 2024). Political institutions are increasingly being deemed to be unresponsive to meeting the needs of many ordinary citizens. For example, a recent Angus Reid survey found that 30 per cent of English-speaking Canadians have no trust in democracy, and nearly 50 per cent do not feel represented by government, with lower-status individuals and individuals dissatisfied with the economy significantly more likely to hold both views (Stockemer and Gaspard 2025). Recent research also shows that the working class in Canada votes at significantly lower rates than all other classes and that this participatory gap has increased substantially over time (Polacko 2025). A key culprit has been the reduced relative economic saliency offered by political parties over time: Canada’s party system has not been providing the requisite saliency to economic issues needed to keep lower-status individuals political engaged. It is unsurprising that much of the working class is checking out of politics, especially when there is mounting cross-national evidence that legislators produce substantially biased outcomes in favour of higher status individuals (Lupu and Warner 2022).
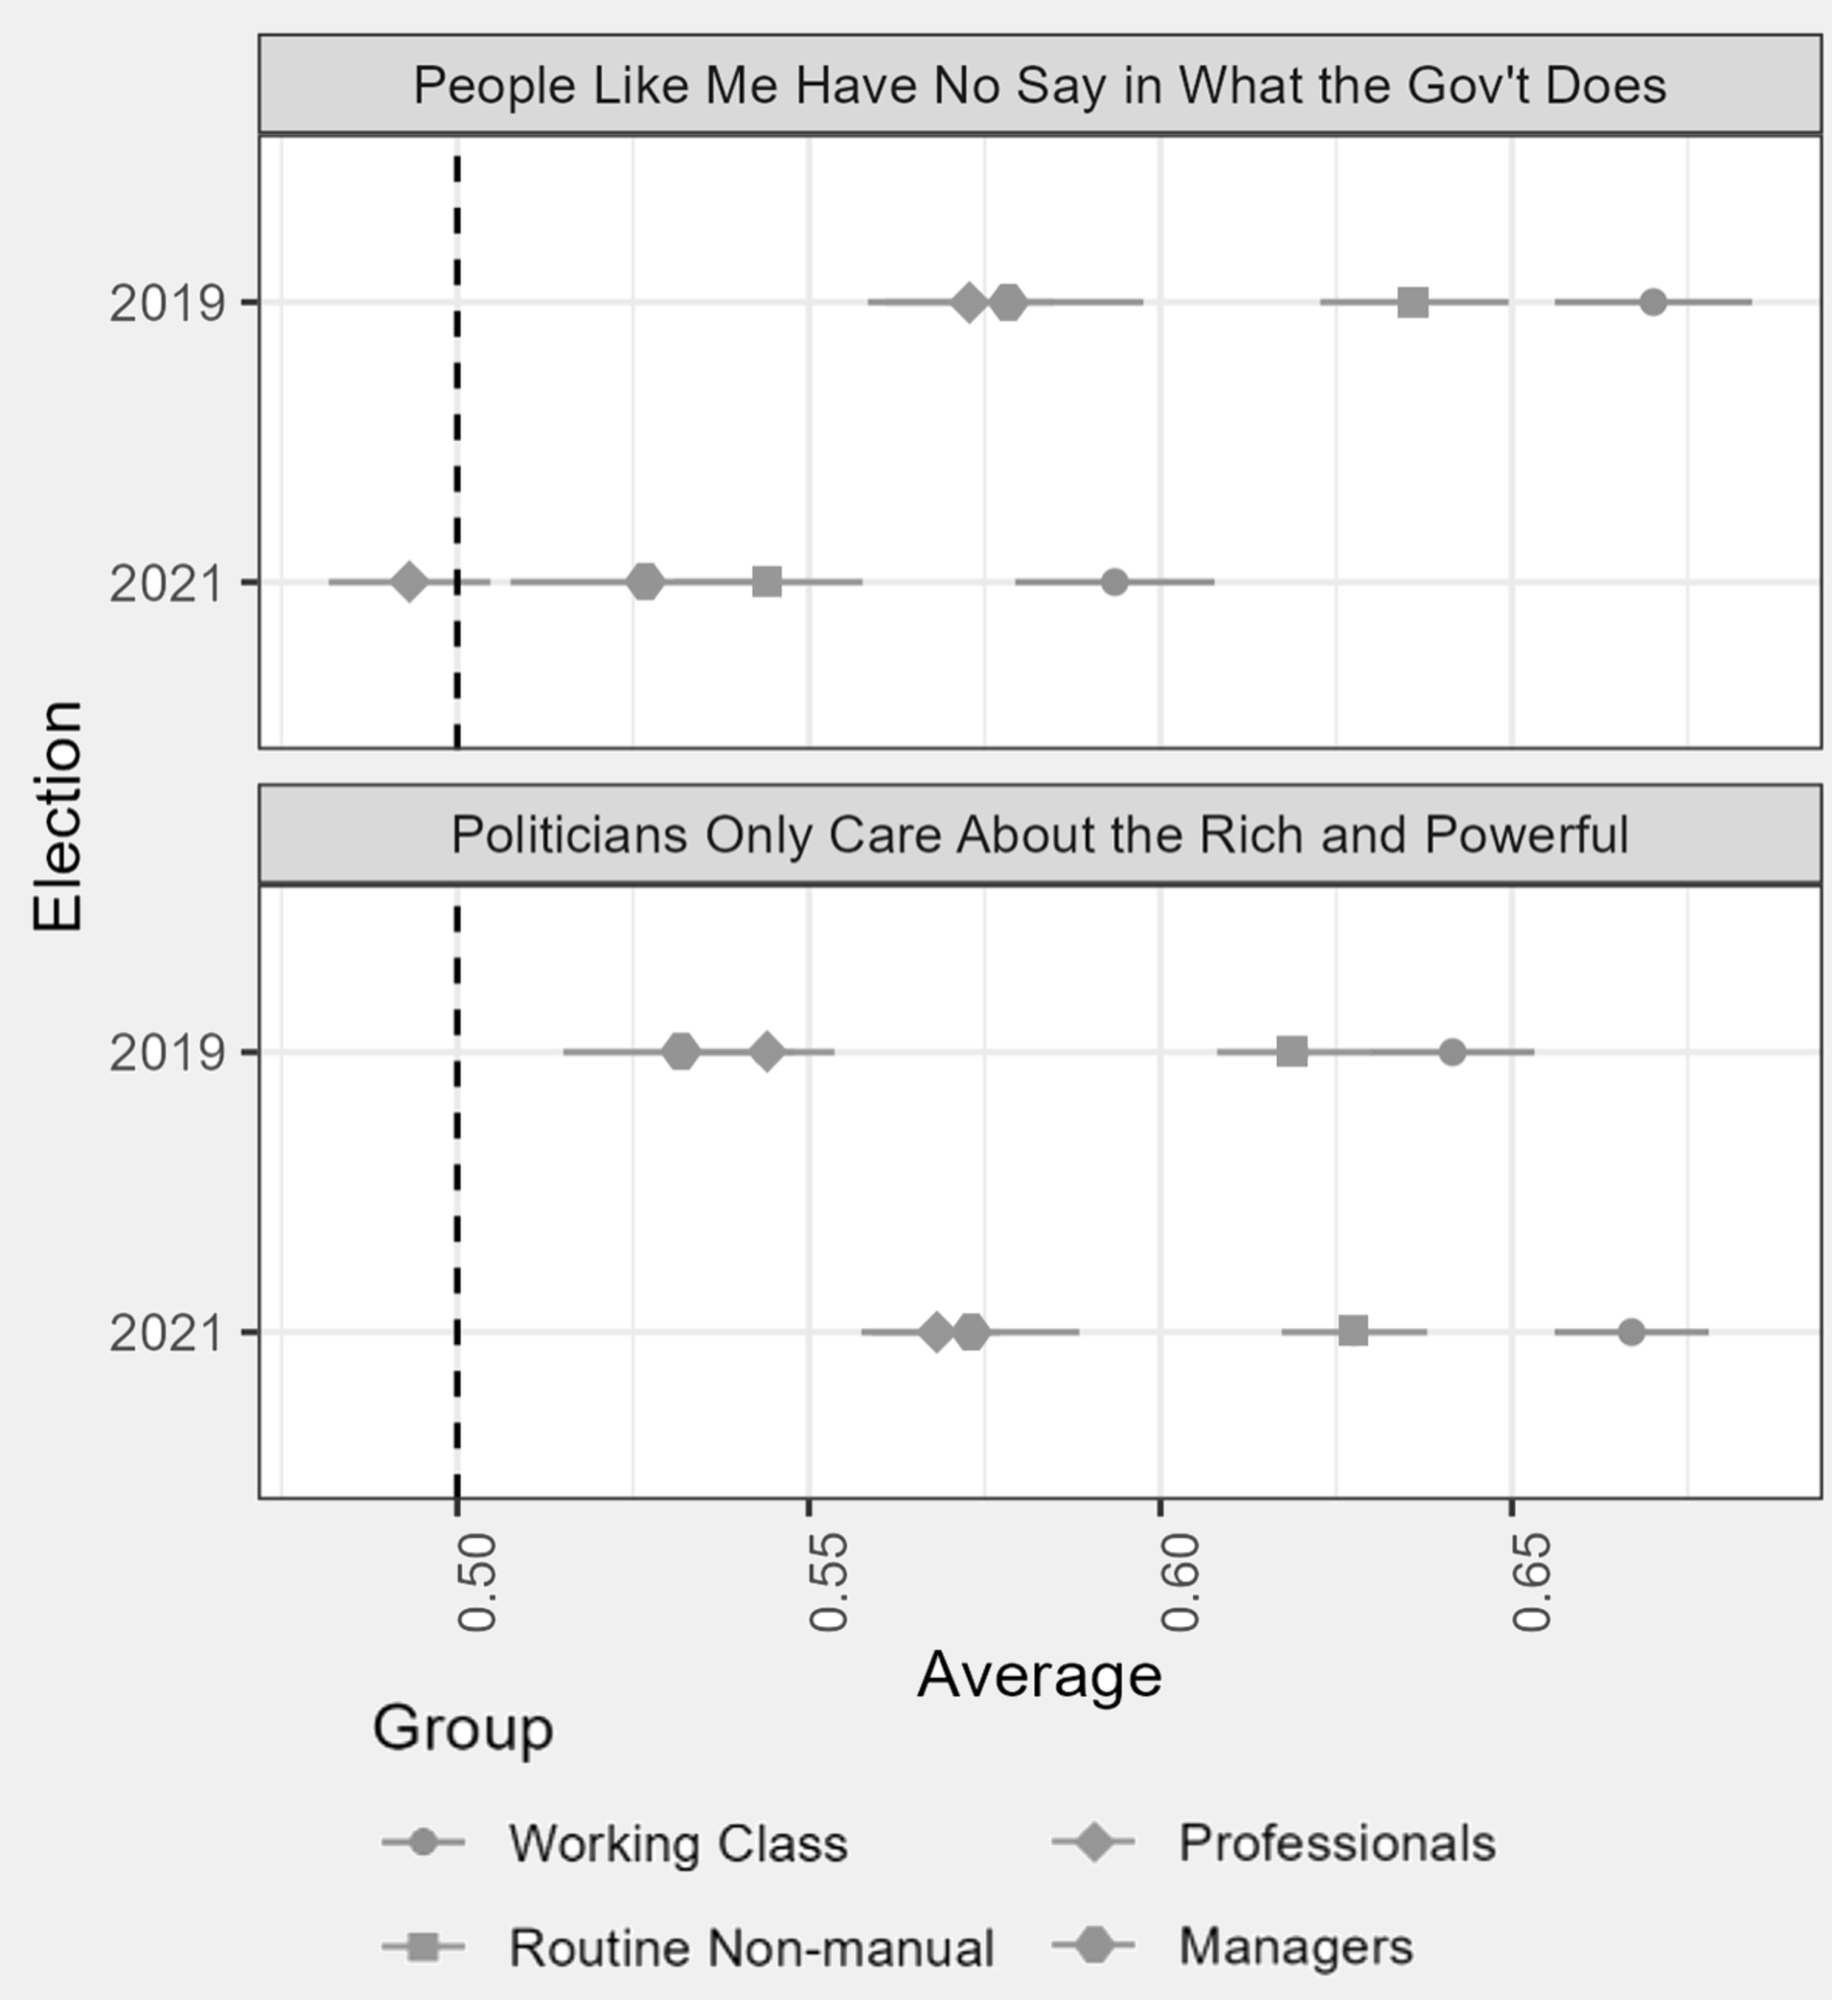
We can measure the political efficacy by social status by using two questions from the 2019 and 2021 CES. The question “people like me have no say in what the government does,” taps into internal political efficacy via feelings of being represented, while the question “politicians only care about the rich and powerful,” taps into external political efficacy via beliefs in who people think are represented by government. So, the two questions measure complimentary aspects of political efficacy.
The results from both questions in each election show similar results. In each case, the working class are significantly more likely to agree with each statement than all other classes. There is a clear class gradient at work for both questions as well, as the routine non-manual class is closest to the working class in positioning, and professionals and managers the least likely to agree with the statements. For the first question, in both elections, the working class are a substantial 10 percentage points more likely to feel that they have no say in government, compared to professionals. Similarly, for the second question, in both elections the working class are roughly 10 percentage points more likely to feel that politicians only care about the rich and powerful, compared to managers.
Taken together, clear majorities of the working class (63% and 66% respectively) are in agreement with the two statements. The working class clearly feels much less represented than the rest of the population and they feel that it is the rich and powerful that are represented by government.
Chart 4 – Mean political efficacy by social class, based on two questions in 2019 and 2021
vOTE cHOICES
Do these attitudes show up in working class voting choices? Our research on class voting in Canada shows that the biggest changes in working-class voting from 1988 to 2019 have occurred in the cultural realm, as the ideologically economic bases of support for the NDP and the Conservatives simply intensified (Polacko, Kiss and Graefe 2022, 2025). However, working-class NDP support is consistently mobilized from the economic dimension, as the link between working-class voters’ economic preferences and their support for the NDP has become more pronounced in the area of redistribution. Contrastingly, the primary driver of working-class support for the right occurs along the cultural dimension. Post-2000 marks a watershed; whereby culturally right-wing members of the working class gradually abandoned the Liberals and NDP for the Conservatives. Led by immigration, cultural preferences have become a much larger predictor of support for both the Liberals and Conservatives, whereby the Liberals have picked up pro-immigration working class voters and the Conservatives have captured anti-immigration voters.
We update this research by analyzing working class voting in the 2021 election. We do so by undertaking logistic regression models estimating working class voting for the four largest parties and including key demographic variables (age, gender, education, income, region, religion, community size, and native-born and union status), as well as the attitudinal variables included in the previous section. We include redistribution and the environment, and we combine our two immigration questions into an immigration index (Cronbach’s α = 0.71), and the questions on gender equality and LGTBQ+ rights into a moral traditionalism index (Cronbach’s α = 0.74). Table 1 displays the results.
We emphasize the following findings. First, most of the demographic variables are not key predictors, beyond the young being a key constituency for the NDP and men for the Conservatives. Second, we find that support for redistribution is the largest predictor of support for the NDP and opposition to redistribution the largest predictor of Conservative support (both significant at p<0.001) but is non-significant for the Liberals and an effect size roughly 3.5 times smaller than for the NDP. Third, both support for moral traditionalism and opposition to the environment are strong predictors for the Conservatives (both significant at p<0.001), but both issues are limited predictors for the Liberals, and moderate for the NDP. Fourth, immigration is the key area of contestation between the Liberals and Conservatives and is a very limited predictor for the NDP. It is the only attitudinal variable that is statistically significant for the Liberals (p<0.001), while it attains an even higher effect for the Conservatives in the opposite direction.
In sum, it appears that redistribution and immigration are the two largest fault lines of party voting for the working class. Redistribution is a key driver of support for the NDP, while immigration is the key driver for the Liberals. And redistribution is largely contested between the NDP and Conservatives, while immigration is the key battleground between the Liberals and Conservatives.
Table 1 – Logistic regression models predicting party vote in 2021 election for working-class sub-sample

We can delve further into attitudinal predictors of party support by simply examining the vote shares among the three big parties for each of the key attitudes examined in this paper: redistribution, immigration, the economy as most important position, and political efficacy. Table 2 breaks down these vote shares among 6 different sub-groups. First, we can see that the Conservatives completely dominate support among individuals who are anti-redistribution with an 87.6% vote share. However, pro-redistribution individuals divide their support somewhat evenly among the three parties. Notably, the Liberals do attain 8.7% greater share than the NDP here, and even the Conservatives win over more pro-redistribution voters than the NDP. Second, the Conservatives also capture a majority of anti-immigration voters, with the NDP and Liberals at a very similar level (16.6% and 18.1% respectively). Third, when we narrow it further to then see who is winning over the most cross-pressured voters in this area (pro-redistribution anti immigration voters), we can see that the NDP and Liberals split the leftist vote nearly precisely the same, and the Conservatives win over more than both parties combined at 43.2%.
Table 2 – Party vote percentages of working-class in 2021 election
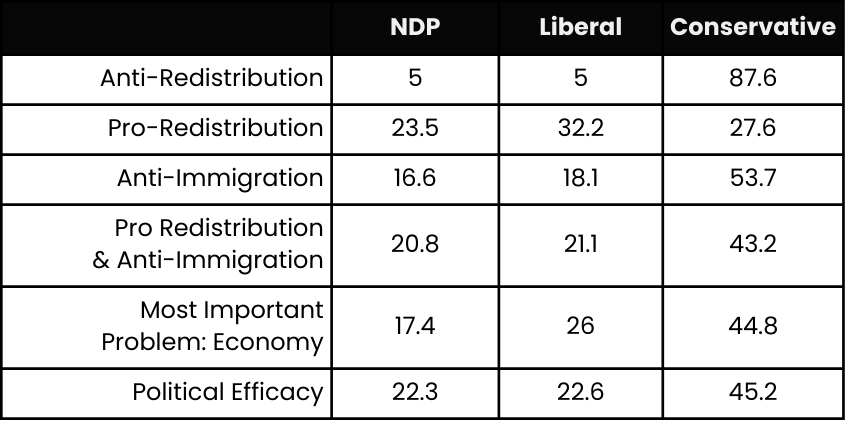
Therefore, even though redistribution is the biggest driver of NDP support and what attracts many voters to the NDP, the party is unable to win over as many pro-redistribution voters as the other big parties. The NDP is at a dead-end in winning over anti-redistribution voters, but importantly, they are also unable to win over very many cross-pressured pro-redistribution anti-immigration voters, as the Conservatives dominate in this area. The NDP also especially lose out on immigration to the Liberals, since the Liberals are viewed as the best choice on the left for this issue. So, the NDP appears to be hemmed in on both sides over immigration, unable to win over many cross-pressured voters, nor can they capture a sizable amount of pro-redistribution voters. Hence, the NDP desperately needs a new strategy in these policy areas, and it would make the most sense to emphasize redistribution and undertake strong leftist movement in this area, while downplaying immigration and separating themselves from the Liberals on the left, so that they can gain a larger share of cross-pressured anti-immigration voters from the working class.
Moving to the party vote shares of working-class members who viewed the economy as the most important problem, the Conservatives once again dominate with 44.8% of the vote. This is more than the NDP and Liberals combined, and 8.5 percentage points above the overall Conservative working class vote. The NDP only attained 17.4% of this group, despite redistribution being the biggest driver of NDP support. The Conservatives’ emphasis on “powerful paycheques” coming from resource development and pipelines offers real material gains to workers. The NDP may be squeezed in this area by its competition with the Liberals to secure environmental votes from middle-class professionals but needs a clearer and more compelling offer to working class voters in this space.
Last, looking at our index of the two political efficacy questions, the Conservatives dominate at 45.2% vote share, which just edges the combined NDP and Liberal totals. The NDP do least well, despite the party’s mantra as being the champion of “the little guy” and being the representative for the working class. Nearly two-thirds of the working class believe that the government only represents the rich and powerful, yet the Conservatives, who have long been the party that best represents the economic elite are able to win a near majority of their members. Clearly the NDP needs to do a much better job at pitching to and convincing this demographic, which should conceivably be very open to the party. Bernie Sanders’ “fight oligarchy” tour this year, drew enormous crowds in America. Perhaps it can motivate a Canadian strategy to reach the working class on economic populist themes, given the substantial resources that the right has invested to harnessing disaffection with conservative cultural appeals.
Conclusion
As the NDP rebuilds, it will need to consider what coalition of voters it seeks to convince. It has traditionally seen the working class as its core voting block, even if its weakness has meant it has long been a cross-class party. The NDP can restore its relative success with the working class if it can find ways to play to the pro-redistribution attitudes of working-class voters. There is also significant support for redistribution among the young and higher educated, whose ranks have increased the NDP’s electoral base. Hence, elements of a redistributive and working-class agenda are already in demand, but many voters and especially the working class, feel politically alienated and disaffected that their interests are not being pursued, while at the same time they perceive politicians as only catering to the interests of the rich and powerful. By fuelling the “culture wars,” the Conservative Party has convinced a significant number of working-class voters to vote against their own economic interests. A big focus for the NDP should be aimed at combating alienation and disaffection among working class voters with stronger economic populist appeals and an economic strategy that promises direct material gains for workers. Nevertheless, there are potential flashpoints between these suggestions and the need to also rebuild support among routine non-manual workers and professionals who moved to the Liberals.
Notes
- We distinguish the working-class from managers, professionals, and the routine non-manual, according to a modified version of Robert Erikson and John H. Goldthorpe’s (1992) widely adopted class schema. The manager and professional categories capture those in the managerial and professional skill levels, while the routine non-manual category includes workers in skill levels B, C, and D, but in occupational categories 1 to 6, and includes occupations such as cashiers, salespeople, executive assistants and administrators.
This classification of the working-class does skew more heavily male at a roughly 2 to 1 rate. It can be faulted for excluding people working in service sector jobs that many would consider as working class (such as cashiers or retail clerks), who are instead included in the “routine non-manual” category. Our interest is not to define what the “real” working-class is. We believe there is value in understanding the voting behaviour of a block of workers (those in manual professions), who once accounted for over a quarter of the workforce and still account for a fifth of all workers, and who have historically been more likely to support social democratic parties compared to other occupational blocks of voters. We hope others apply other occupational schema, or other markers of class, such as we do in studying education and income (Kiss, Polacko and Graefe 2023). ↩︎ - Occupation is not available in the 2000 election. Conservative vote is the amalgamated vote of right-wing parties that split off or merged with the Conservative Party—including Reform, Canadian Alliance, and the People’s Party. ↩︎
- We display the 2019 phone survey mode results. It should be noted that there are significant differences between the phone and web survey results. For example, the Conservative vote is 16.6% lower in the web survey; Liberal vote is 12.35% higher; NDP vote is 3.38% higher; and Bloc vote is 1.46% lower. ↩︎
- Each of the attitudinal variables are rescaled between 0–1 (left to right) for consistency. ↩︎
References
Click here for a full list of references
Environics Institute for Survey Research. (March 7, 2024). Support for democracy in Canada: A Report from the 2023 Americas Barometer Survey in Canada. Toronto. https://www.environicsinstitute.org/projects/project-details/support-for-democracy-in-canada-2023.
Inglehart, Ronald. (1977). The Silent Revolution: Changing Values and Political Styles Among Western Publics. Princeton: Princeton University Press.
Inglehart, Ronald. (1990). Culture Shift in Advanced Industrial Society. Princeton: Princeton University Press.
Kiss, Simon, Matthew Polacko, and Peter Graefe. (2023). “The education and income voting divides in Canada and their consequences for redistributive politics.” Electoral Studies. 85. 102648.
Koop, Royce, and Jim Farney. (2025). “Blue-Collar Tories: Symbolism, Populism, and Economic Nationalism on the Contemporary Canadian Right.” In Jacob Robbins-Kanter, Royce Koop, and Daniel Troup (eds), The Working Class and Politics in Canada (pp. 158–182). Vancouver: UBC Press.
Lupu, Noam and Zach Warner. (2022). “Why are the affluent better represented around the world?” European Journal of Political Research. 61(2): 67–85.
Moawad, Jad. (2023). How the Great Recession changed class inequality: Evidence from 23 European countries. Social Science Research. 113: 102829.
Osberg, Lars. (2024). The Scandalous Rise of Inequality in Canada. Toronto: James Lorimer and Company.
Polacko, Matthew. (2025). “Canada’s Increasing Class-Based Voting Disparities Amidst Declining Economic Policy Saliency.” Canadian Journal of Political Science. 1–27. https://doi.org/10.1017/S0008423925100462.
Polacko, Matthew, Peter Graefe, and Simon Kiss (2025). “Revisiting the Sectoral Cleavage in Canada: Evidence from the Canadian Election Studies.” Canadian Review of Sociology. 1–15. https://doi.org/10.1111/cars.70014.
Polacko, Matthew, Simon Kiss and Peter Graefe. (2022). “The Changing Nature of Class Voting in Canada, 1965–2019.” Canadian Journal of Political Science. 55(3): 663–686.
Polacko, Matthew, Simon Kiss and Peter Graefe. (2025). “The Long and Short View of Working-Class Voting in Canada.” In Jacob Robbins-Kanter, Royce Koop, and Daniel Troup (eds), The Working Class and Politics in Canada (pp. 185–211). Vancouver: UBC Press.
Rennwald, L. (2020). Social Democratic Parties and the Working Class : New Voting Patterns. Springer International Publishing. https://doi.org/10.1007/978-3-030-46239-0
Stockemer, Daniel and Valere Gaspard. (2025). “Canadian Democracy at Risk? A Wakeup Call From the Perspective of English-Speaking Citizens.” Politics & Policy. [Online]: https://doi-org/10.1111/polp.70008.
Westlake, Daniel, Larry Savage, and Jonah Butovsky. (2025). “The Labour Vote Revisited: Impacts of Union Type and Demographics on Electoral Behaviour in Canadian Federal Politics.” Canadian Journal of Political Science. 1–24. https://doi.org/10.1017/S0008423925100449.
Wike, Richard, and Janell Fetterolf. (June 18, 2024). “Satisfaction with democracy has declined in recent years in high-income nations.” Pew Research Center. https://www.pewresearch.org/short-reads/2024/06/18/satisfaction-with-democracy-has-declined-in-recent-years-in-high-income-nations/.