Over the past decade, home prices have surged out of reach of a growing majority of Canadians. Home ownership rates have begun a historic decline as housing investors bid up and buy out a fast-growing share of the country’s condo apartments and houses. Crowded out of homeownership, upper income residents are being flooded into a tight rental system where lower income communities face declining affordability and security of tenure. Meanwhile, institutional investors and large corporate landlords are on a “buying spree,” acquiring a rising share of Canada’s aging purpose-built rental stock, often to ‘reposition’ them, i.e. displace their lower-income tenants (August et al, 2023: 8; August, 2020).
Ownership of housing is becoming increasingly concentrated in the hands of wealthy Canadians, fostering a worsening status quo for everyone else.
Canada is not alone in facing these trends. Scholars focused on the political economy of housing have identified the rise of investor ownership of housing as a major driver of home price escalation and the “retreat of homeownership” (Smith et al, 2022) over the past two decades in the United States (Christophers, 2023; Fields, 2022), the United Kingdom (Ronald & Kadi, 2018; Bangham, 2019), Ireland (Byrne 2020); Australia (Ryan-Collins & Murray, 2021), Europe (Wind et al, 2020; Aalbers et al, 2021; Hochstenbach & Aalbers, 2023; Torrado et al, 2020), and beyond (Kadi et al 2020; Doling & Ronald, 2012).
These trends are often described in epochal terms, ushering a shift towards “late homeownership” (Forrest & Hirayama, 2018) or “post-homeownership” societies (Ronald & Kadi, 2018; Arundel & Ronald, 2021) in which housing rentiers claim a growing share of national income and wealth. “As housing wealth slips from the hands of home-occupiers into the portfolios of individual and institutional rentiers,” the 21st century appears set to return to levels of inequality reminiscent of those of the nineteenth century, “wherein most households rented their homes and owned (nearly) nothing else.” (Smith et al, 2022: 170, 180)
In the absence of strong government interventions these trends are expected to intensify.
This is the first in a three-part series analyzing the rise of investor ownership of housing across Canada, its impacts on the present housing crisis, and what can be done to reverse its inequitable consequences through public policy.
This first part assesses the growing role of housing investors in driving home price escalation, declining access to homeownership, and increased risks of economic instability. Building on newly released datasets from Statistics Canada (StatCan), the analysis fills an important research gap documenting the fast-growing scale of investor ownership of condo apartments and houses across Canada. Investors are found to be acquiring especially large shares of recently built housing (in some cities the majority) and the most affordable housing for sale (i.e. condo apartments). These findings raise serious doubts about the extent to which policies aimed at spurring market-rate housing supply can be expected to expand access to “attainable” housing.
The second part analyzes how the rising concentration of investor ownership is transforming Canada’s housing system. Building on recently released mortgage and housing transactions data, investors are found to be increasingly crowding out prospective first-time buyers. Province-by-province, the analysis documents the close relationship that has developed over the past decade between: (1) rising rates of investor ownership; (2) declining rates of home ownership, and (3) the rising share of tenants housed in condo apartments and houses on the secondary rental market. These trends are shown to be contributing to surging demand from upper income renters locked out of homeownership, and declining security of tenure, especially for lower income tenants. Province-by-province, the analysis also identifies who investment properties are owned by, revealing the vast majority are owned by wealthy older Canadians, while many are also held opaquely through corporations. Only a small minority are owned by non-Canadians.
The third part of this analysis assesses the outcomes of policies recently implemented in countries seeking to reduce speculative demand (such as the United Kingdom, New Zealand, and the Netherlands), and the outcomes of those implemented in Canada thus far (such as restrictions on foreign buyers, home flipping, and empty homes). It recommends a range of public policy interventions different orders of government could take now.
Altogether, this series seeks to advance a democratic socialist agenda for transforming our current housing system, which is unsustainably financializing and concentrating control over basic human rights.
Investor Ownership: A Growing Concern
Over the past two decades, the average cost of owning a home has risen far faster than the incomes of ordinary Canadians. Yet even as demand from prospective first-time buyers has been suppressed, overall demand has continued to heat up throughout much of the 2010’s and the pandemic, escalating home prices further. Indeed, according to the Organization for Economic Co-operation and Development (OECD), Canada’s home price-to-income ratio increased at a greater rate than any other country in the G7 since 2009. Today, unaffordability remains suspended at record highs. How have prices become so decoupled from local incomes?
One prominent explanation is that Canada suffers from a “chronic insufficiency” of housing development. Advocates of this perspective attribute surging home prices to shortages in the number of homes available per person, often arguing that planning regulations and taxes are impeding market-rate developers from building fast enough to satisfy demand.
In recent years this explanation has proven highly influential, rallying decision-makers to initiate long-overdue planning reforms, such as increasing the allowable density of housing developments in neighborhoods zoned exclusively for single-family houses. However, many analysts suggest this supply shortage explanation seriously underestimates the role of other factors in driving the escalation of home prices.
Analyzing housing supply-responses across Canada between 2002 and 2022, Pomeroy compares the available data on rates of population and household growth, new home construction, and price escalation. He finds “little evidence of a chronic undersupply” Canada-wide, or in Canada’s eight largest metropolitan areas, except for an “anomalous” shortfall in the Greater Toronto Area (2023: 36, 33).
Others have reached similar conclusions. A study by the International Monetary Fund (IMF) in 2018 compared the responsiveness of housing supply to rises in demand in 20 “advanced economy” countries between 1989 and 2016. They found Canada’s planning and development institutions to be the second most responsive (in their words, “elastic”) after the United States. Researchers at the Bank of Montreal (BMO) suggest supply remains responsive, finding that between 2017 and 2022, Canada’s ratio of new housing starts to population growth is “not out of kilter with long-run averages…[and is] even a bit above the long-run norm.” Another 2022 analysis by BMO highlighted that over the past two decades, Canada’s housing stock has grown at a faster rate than new households formed. It concludes that “the country doesn’t have a supply problem so much as an affordability problem due to recurring waves of excess demand pressure.”
Chart 1 compares changes in home prices to changes in the number of occupied homes per person.1 Canada-wide, there appears to be no connection over the past two decades between the escalation of home prices and declines in the availability of housing.2 During periods in which home prices escalated (2009-2017 and 2020-2022) the housing stock grew faster than the overall population. And during periods in which prices plateaued or declined (Q3-2017 to Q4-2019 and Q3-2022 to Q3-2023) the population grew faster than the housing stock. Indeed, in the two-year period in which prices shot up the most (Q1-2020 to Q2-2022), Canada achieved the highest number of homes per person.
Chart 1 – Changes in Homes Prices & Number of Homes per 1,000 People, Canada
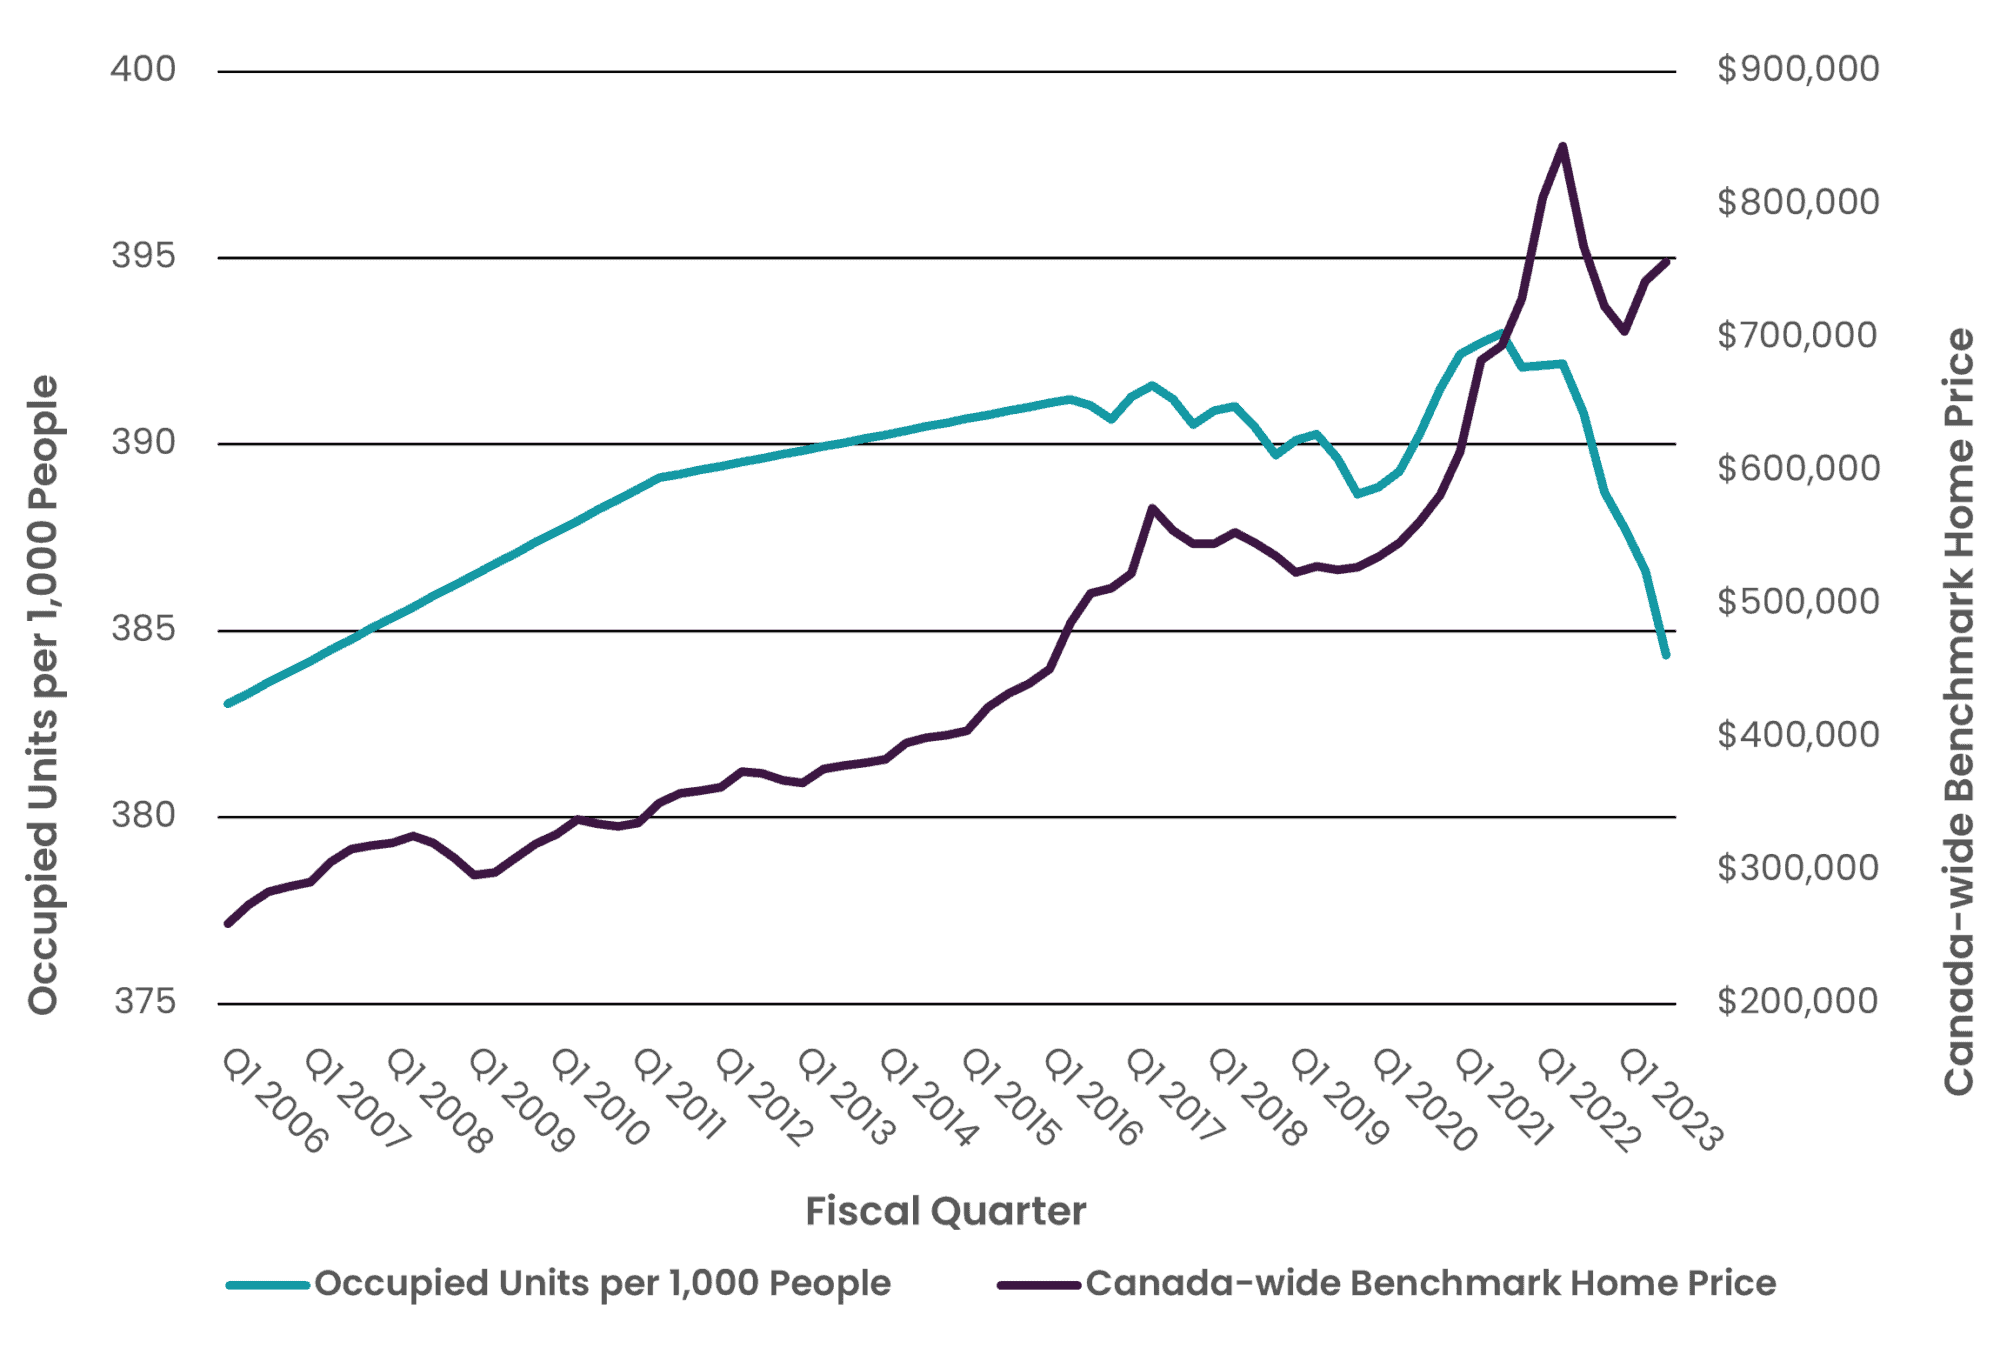
Factors over and above changes in the number of homes per person appear to be playing a major role in driving surges in the price of owning a home.3
Nonetheless, chart 1 does indicate that Canada-wide supply shortages have developed quite recently. Since mid-2022, population growth has notably outpaced housing supply. Indeed, between Q3-2022 and Q3-2023, population grew at close to double the post-1945 average (3.2%); far faster than housing can feasibly be built at present. The spike is largely due to an unprecedented and apparently unanticipated rise in temporary residents (such as students and workers), permitted to stay for up to three years. (Al Mallees, 2023) This is now the subject of intense public scrutiny to which the federal government is beginning to respond, passing policies aimed at bringing population growth closer to pre-2022 averages. Whether this will occur in the near-term is unclear.
What is clear, however, is that far more needs to be done than simply slowing population growth and building market-rate housing faster, if Canadians want to see housing affordability return to levels enjoyed by earlier generations.
Policies aimed at increasing the number of market-rate homes per person alone cannot be trusted to address Canada’s growing array of unmet housing needs. A more targeted approach is required; identifying and supplying the types of housing we need, and restricting the speculative demand we do not need.
There is of course a harrowing deficit of certain types of housing across Canada, above all housing affordable to lower income communities. As Whitzman’s 2023 report for the Federal Housing Advocate emphasizes, “the fact that the vacancy rate for low-cost rentals is 0–1% in most major Canadian cities suggests…a focus on supply (either new build or acquisition to maintain affordability) will be necessary to address homelessness and core housing need.”
Supply-side interventions to speed up development and increase allowable densities can and should play an important role in addressing these unmet needs. However, as Whitzman’s report rightly stresses, it’s imperative these interventions are firmly grounded by supply targets, specifying: the type and depth of affordability actually needed, and the policies and partnerships required to build or acquire them. As we will see below, a huge share of newly built housing will likely be bid up and bought out by wealthy investors in the absence of more targeted government interventions.4
What is Super-Charging Demand?
Shifting attention to demand-side factors, the analysis focuses on basic questions: How have buyers been able to bid up and buy homes at prices increasingly decoupled from local incomes? What transformations have occurred in recent decades to raise their bidding power?
Scholarship on the financialization of housing has long highlighted the close relationship that can develop between rising access to mortgage debt, rising home prices, and rising demand from housing investors. (Aalbers, 2016; Ryan-Collins et al, 2017; Aalbers et al, 2021)
In countries where finance and housing are predominantly provisioned through liberalized market-based systems, research has documented a tendency for the growth of debt and home prices to become mutually reinforcing (Fernandez & Aalbers, 2016; Ryan-Collins, 2021). As mortgage interest rates decline and regulations such as down payment requirements or amortization periods are loosened, those competing to buy market-rate homes typically respond by borrowing more and bidding higher for the same product. Furthermore, as prices escalate, those supplying mortgages typically respond by lending more, as the loans are perceived to be backed by high quality collateral. Buyers then develop extrapolative expectations of further price increases and fears of missing out; demand is further stoked. Thereby a “housing-finance feedback cycle” can develop, “with ever rising house prices and ever increasing household debt making our economy highly vulnerable to economic shocks.” (Ryan-Collins et al, 2017: 112)
As the 2007/9 Global Financial Crisis (GFC) painfully clarified, these debt-driven booms are inherently unsustainable, as “[h]ouse prices and debt service costs cannot fully and indefinitely decouple from income levels.” (Fernandez & Aalbers, 2016: 12) However, as the years that followed have also painfully clarified, the decoupling of prices and incomes can be further extended by another factor: rising demand from rich housing investors. (Hochstenbach & Aalbers, 2023) Leveraging their higher incomes and increasingly valuable properties to further bid up prices and expand their portfolios, housing investors can further amplify the housing-finance feedback cycle.
The role of mortgage debt and investor demand in contributing to housing affordability crises is widely acknowledged in recent research by mainstream economic policy-making organizations such the US Federal Reserve, the OECD and the Bank of International Settlements (BIS). For example, a major study by the OECD in 2022 concluded: “[a] key driver of stark house price increases in the past two decades has been the historical decline in real interest rates, which has been reinforced by expansionary monetary policies […and] encouraged real estate investments by institutional investors and high-net-worth individuals.” Recent research by the BIS concurs, diagnosing the surge in home prices during the pandemic as driven, “[a]bove all [by] exceptionally easy financing conditions,” which, “boosted demand for housing […] turning dwellings into attractive assets, including in the buy-to-let segment.”
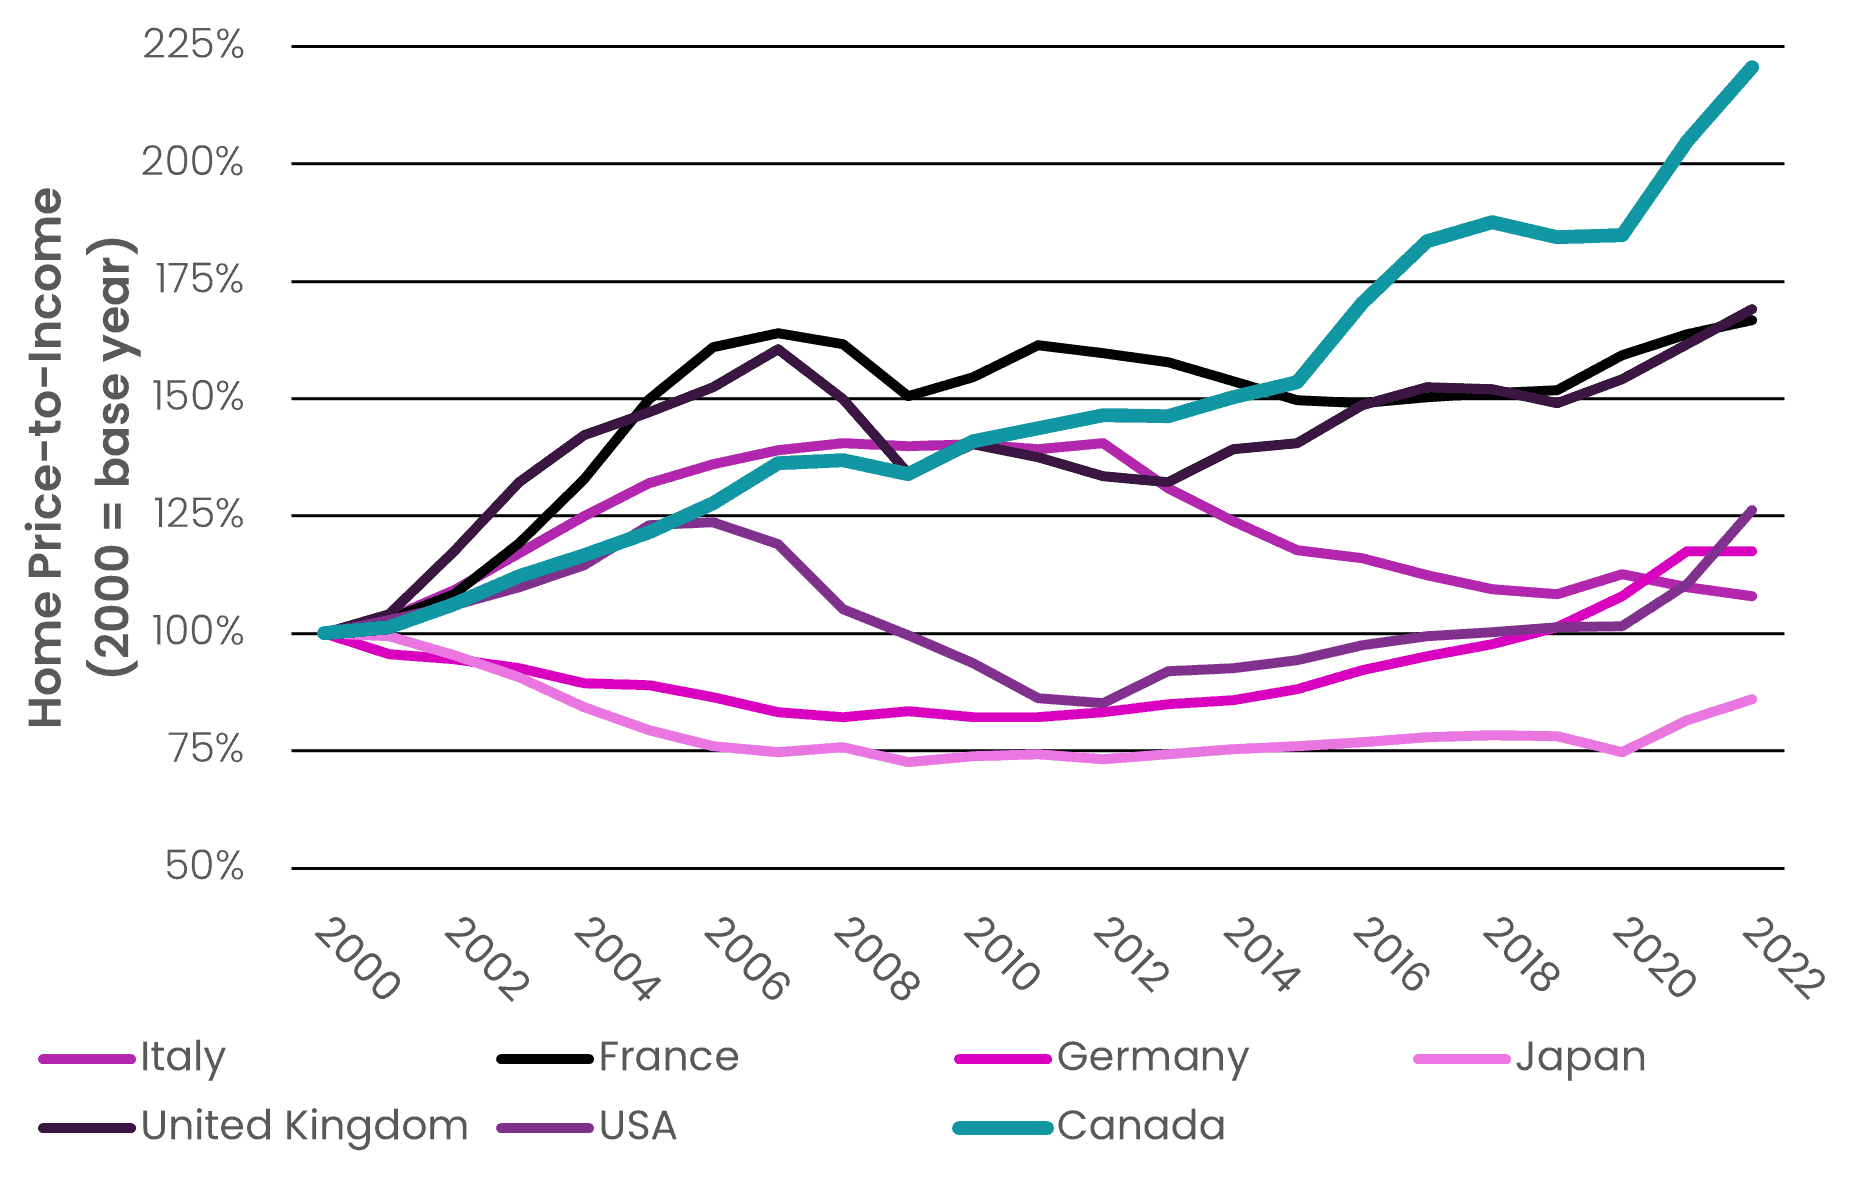
These trends can quickly become destabilizing. Surges in mortgage debt relative to income (Wood & Stockhammer, 2023; Mian & Sufi, 2015) and surges in demand from housing investors (Lee et al, 2011; Allen et al, 2018; Garriga et al, 2023; Albanesi et al, 2022) have been found to be associated with boom and bust cycles in various countries. This is especially concerning in Canada, where over the past decade investor demand has surged, and (as charts 2 and 3 portray starkly) rates of household indebtedness and housing unaffordability have risen at rates surpassing other peer-countries in the G7.5 The following data documents the growing role of both factors in supercharging housing demand in Canada.
Chart 2 – Household Debt as a % of Disposable Income
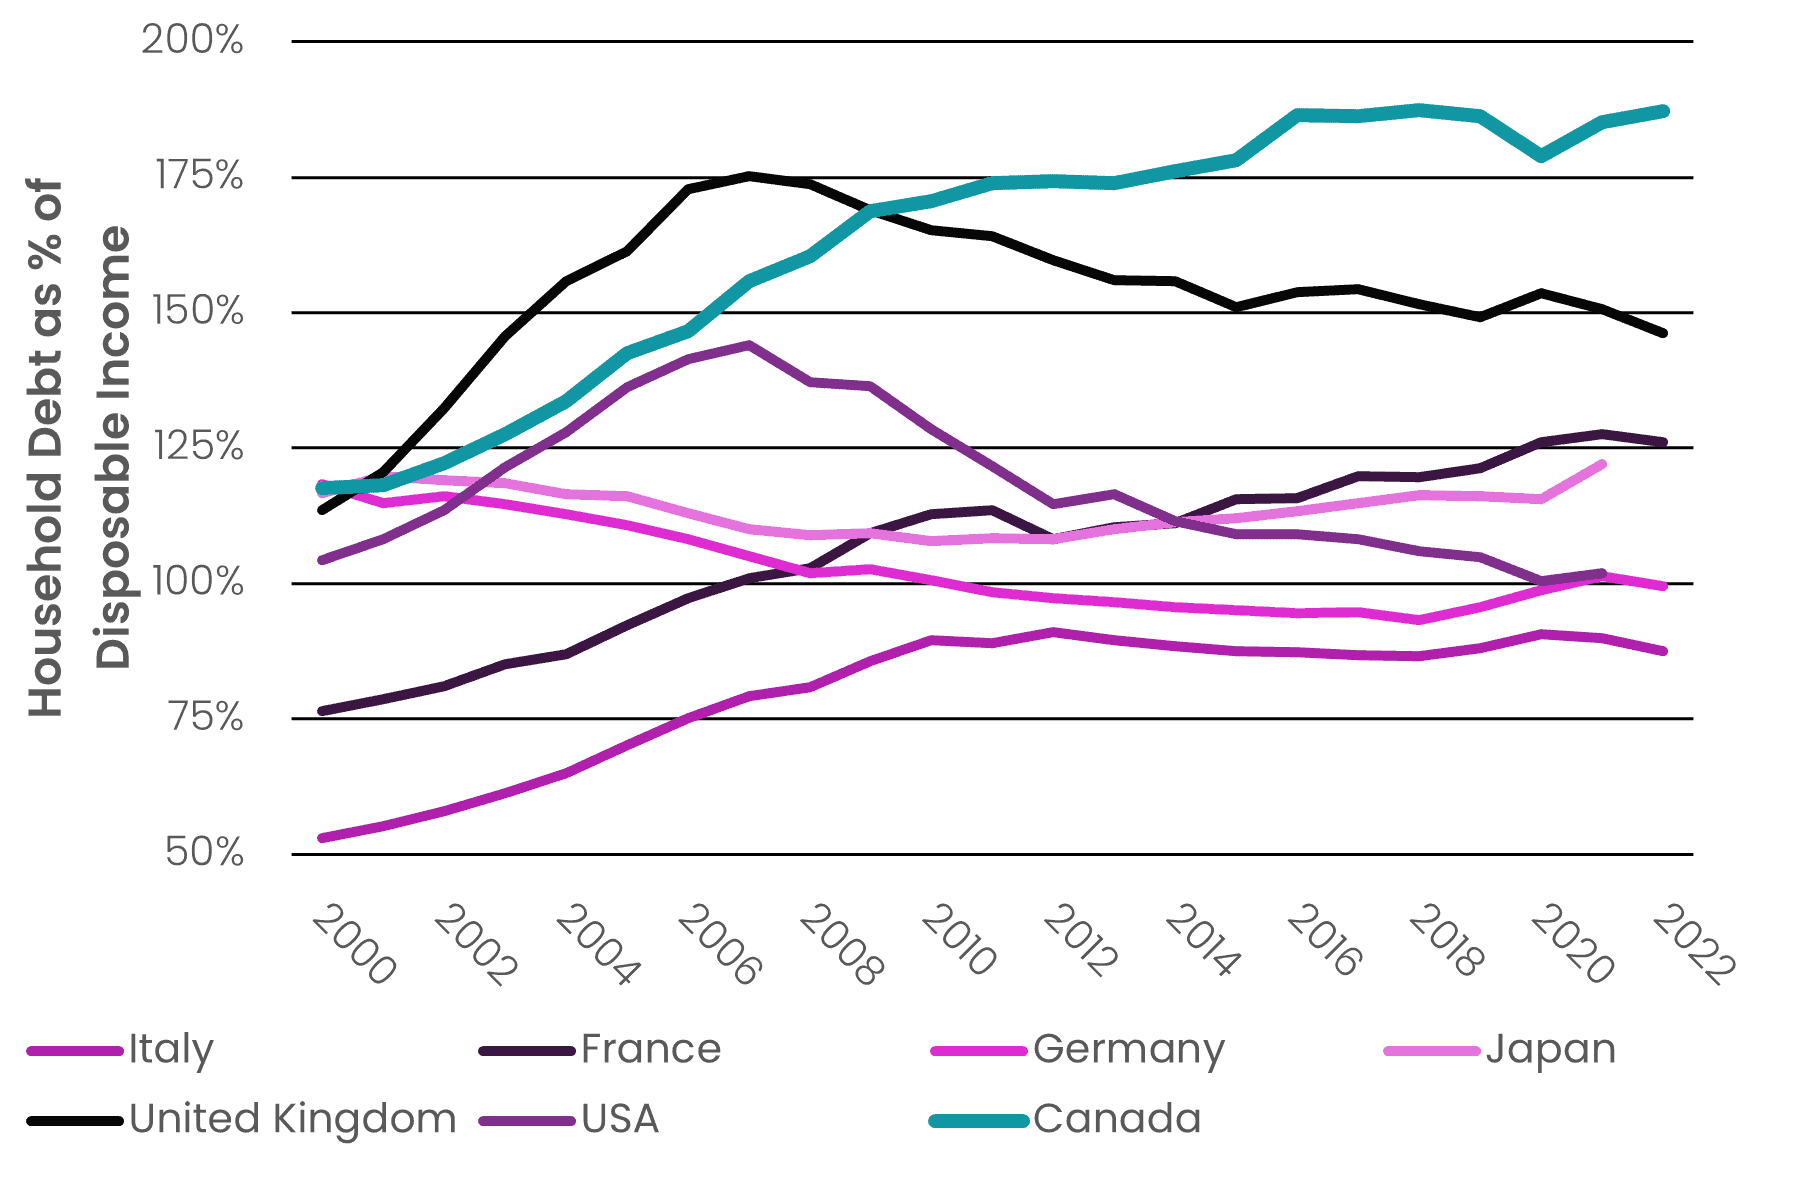
Chart 3 – Change in the Home Price-to-Income Ratio
Explosive Growth in Mortgage Debt
In the 1980’s and 90’s neoliberal governments in Anglo-American countries rolled back investment in non-market housing and re-regulated their financial sectors to facilitate an explosion in leverage and indebtedness. Between 1980 and 2010, bank credit grew at almost double the rate of national income (GDP) on average among most rich countries. (Jorda et al, 2016)
At the time, neoclassical economists and industry lobbyists confidently asserted that giving financial markets freer reign to originate and distribute credit would strongly benefit national economies. Profit-oriented actors were perceived as best placed to determine the optimal allocation of credit. Promoting an expansion of private financial activities, neoliberals hoped to usher in surges in productivity-enhancing investments, reducing the cost of living. Instead, they initiated a mounting credit glut that has mostly been channeled toward bidding up the prices of pre-existing assets, fostering de-stabilizing “ponzi-dynamics,” (Walks, 2010: 54) increasingly top-heavy distributions of wealth, and housing affordability crises in many countries. Between 1990 and 2010 mortgage debt accounted for close to 90% of the “unprecedented increase” in bank credit. (Jorda et al, 2016: 127) As Adair Turner, former chairman of Britain’s Financial Service Authority, laments, “[t]he vast majority of bank lending” is being used to fund, “the purchase of already existing assets, in particular real estate and the urban land on which it sits […] the result is not new investment but asset prices increases, which induce yet more credit.” (2016: 6)6
In Canada, successive federal governments have developed a distinctively deep level of state involvement in underwriting and channeling funding into the country’s mortgage market. Since the early 2000’s, the role of the federal government’s housing agency, the Canada Mortgage and Housing Corporation (CMHC) in, “insuring, guaranteeing, and purchasing […] mortgages that have been bundled into [mortgage-backed securities],” has contributed to an unprecedented increase in mortgage lending. (Walks & Clifford, 2015: 1627) Financial institutions have eagerly originated mortgages, confidently raking in revenue “risk free” from increasingly indebted Canadians. (Walks & Clifford, 2015: 1628; Walks & Simone, 2016) During the GFC and the COVID-19 Pandemic, their confidence was reaffirmed as the CMHC and Bank of Canada (BoC) were marshaled to acquire massive portfolios of mortgage loans from lenders. (Walks, 2014; August et al 2022) Injecting them with capital and reducing their balance sheets, these federal agencies spurred lenders to originate still more mortgages.
Altogether, these policy interventions have contributed to historic declines in mortgage rates, and an explosion in mortgage debt. However, far from making home ownership more affordable, they’ve ultimately driven those competing to buy market-rate homes to borrow more and bid higher for the same product. As the BoC’s Deputy Governor acknowledged in retrospect in 2021, “when interest rates fall, many households simply adjust by borrowing more.”
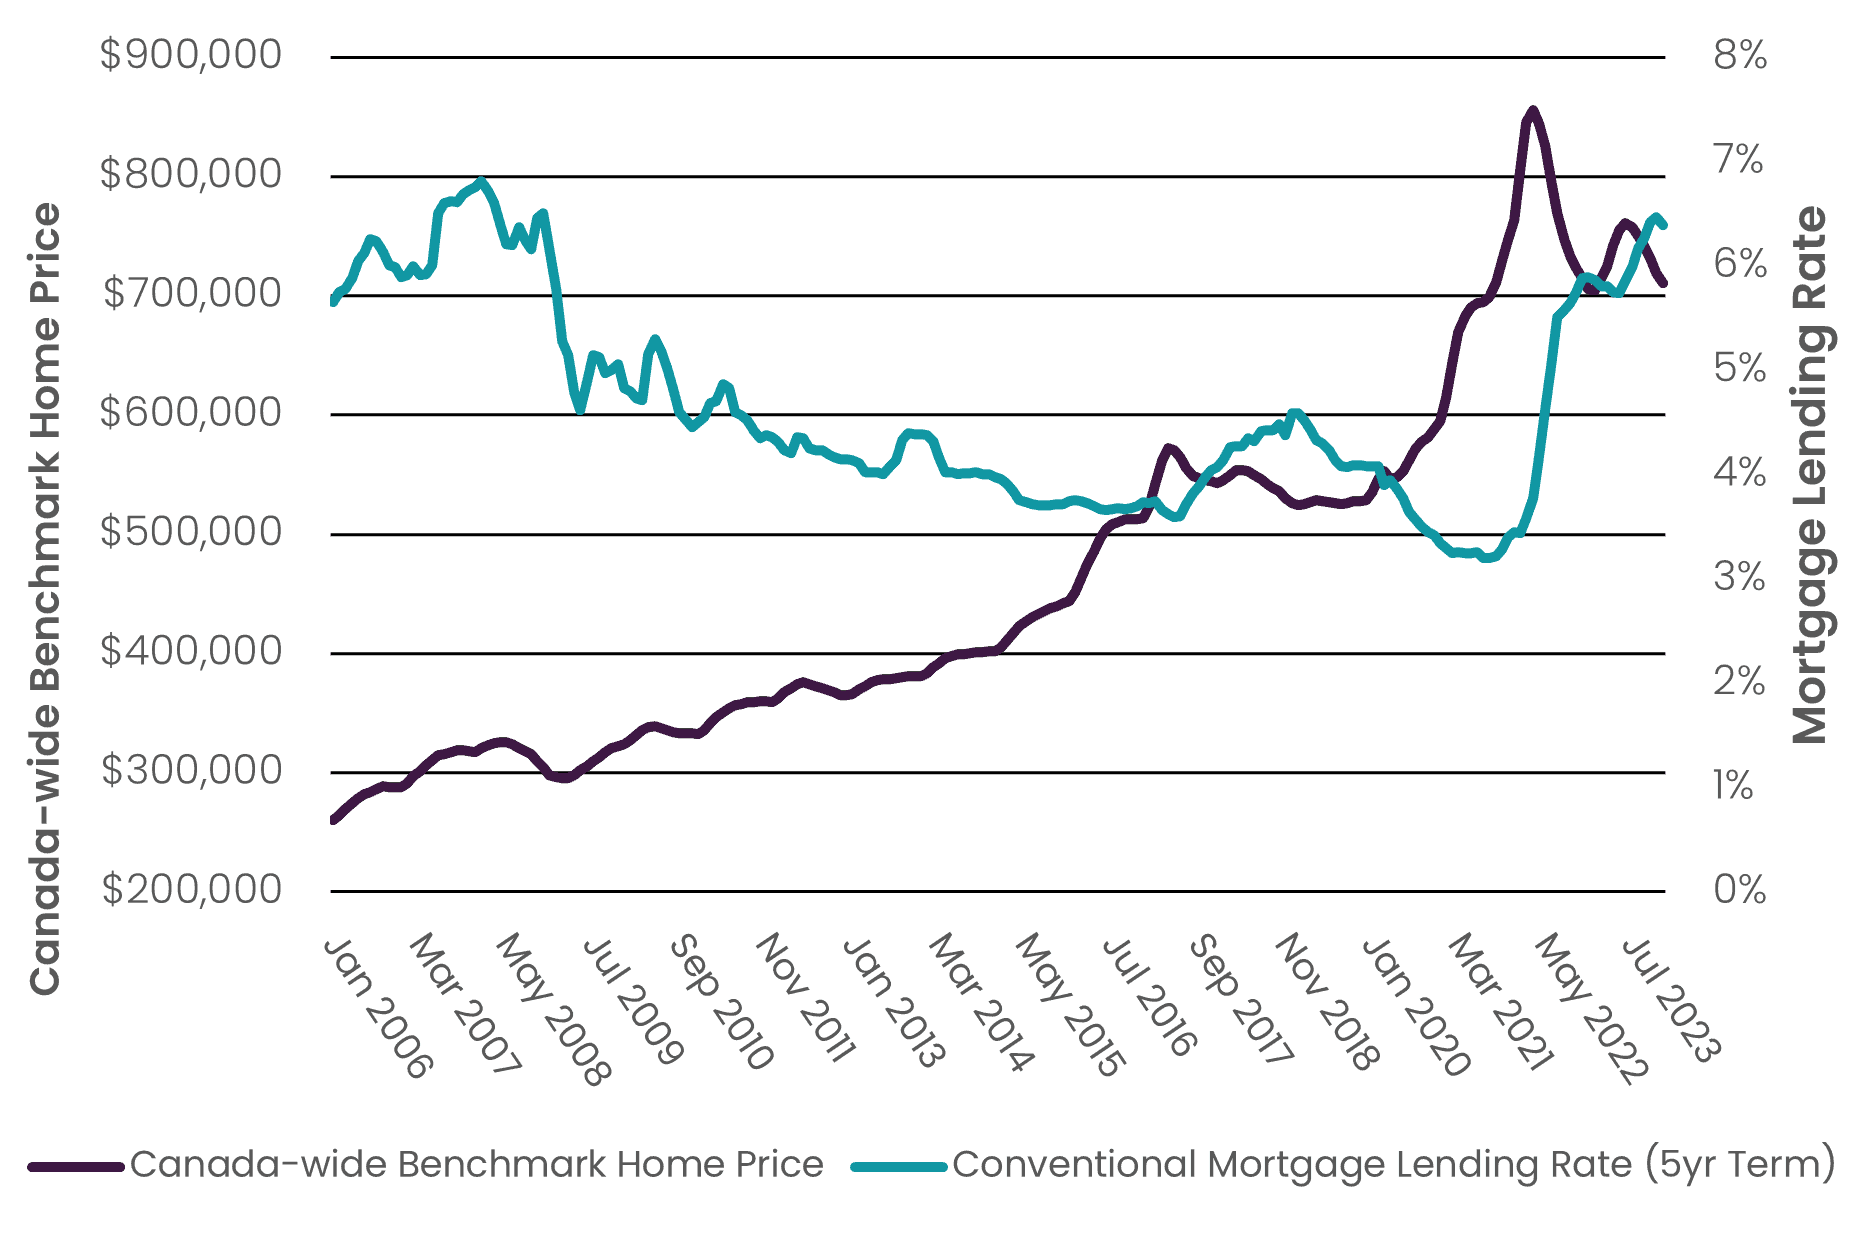
Chart 4 demonstrates the close relationship between mortgage interest rates and home price escalation in Canada.7 During periods in which rates fell (2009-2017 and 2020-2022) home prices escalated substantially. During periods in which rates were raised (Q3 2017 to Q4 2019 and Q2 2022 to Q3 2023), prices plateaued or declined.
Chart 4 – Change in Home Prices and Conventional Mortgage Rates, Canada, January 2006 to December 2023
These policy interventions have facilitated explosive growth in outstanding mortgage debt.
Between 2001 and late 2023 the real (inflation-adjusted) value of all mortgage debt in Canada rose from $600 billion to $1.9 trillion dollars, more than tripling. At the same time, the real value of all household disposable income grew far slower, from just over $1.0 trillion to 1.6 trillion, rising by a little over half.
This unprecedented leveraging has made Canadian households among the most indebted in the world. Over the past decade, it has provided the fuel for one of the fastest escalations in home prices relative to incomes of any country in the OECD, second only to Portugal.
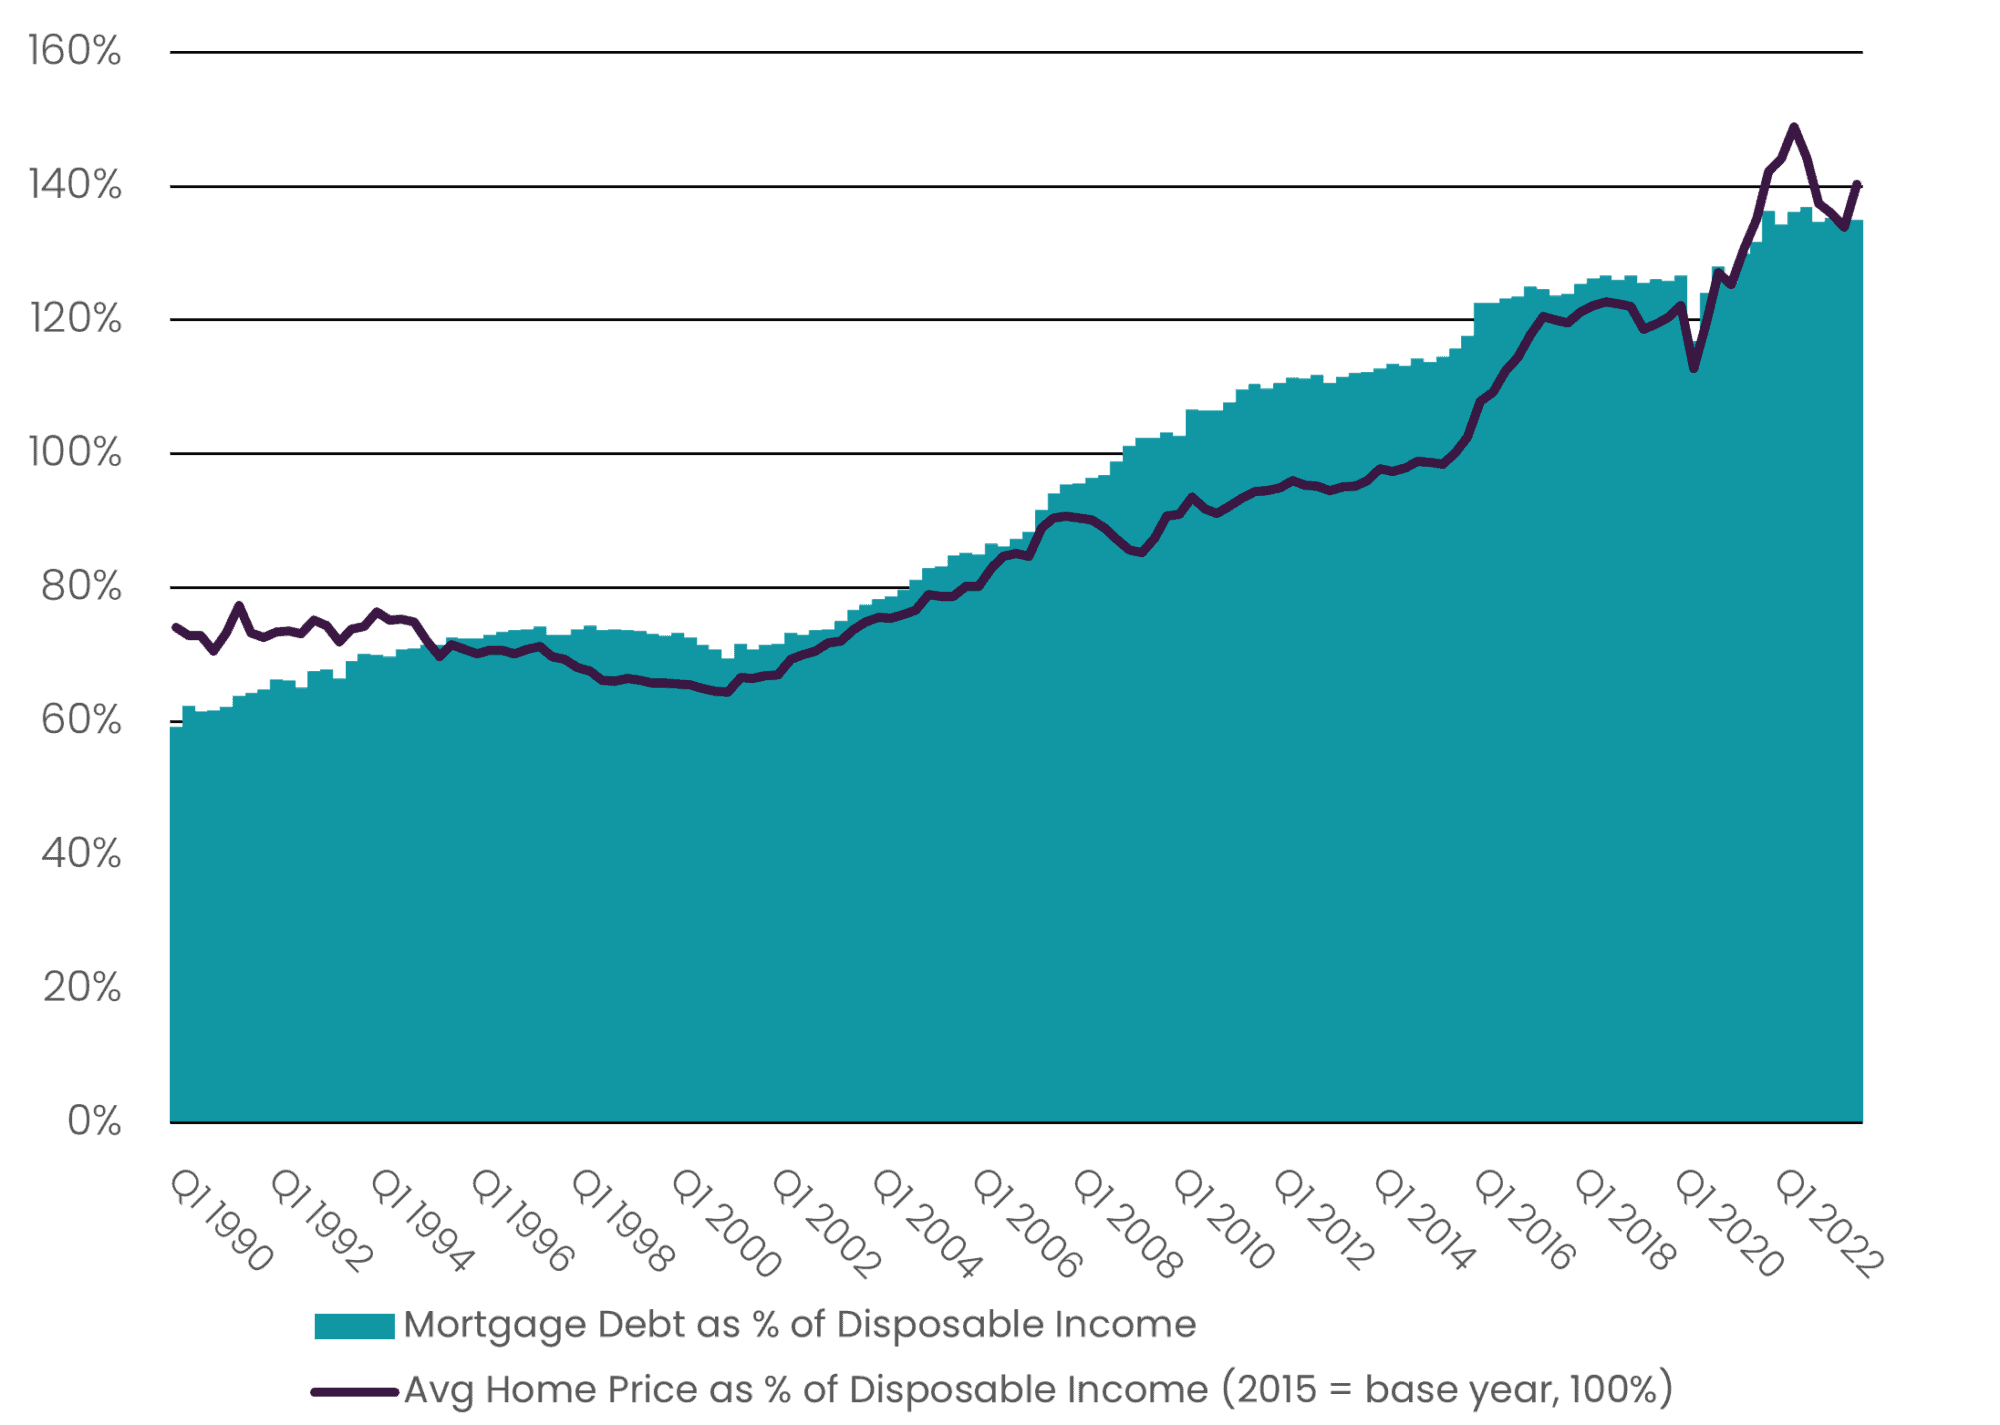
As Chart 5 indicates,8 between 2011 and late 2023, the sales price of an average home has increased at well over double (2.2 times) the rate of the disposable income of Canadian households.
Chart 5 – Mortgage Debt-to-Income Ratio & Price-to-Income Ratio, Canada ,Q1-1990 to Q3-2023
In a system dominated by market-rate housing supply, this explosion in indebtedness has proven highly inflationary. As critical housing scholars long warned, its logical outcomes have been rising profits for private finance and real estate, and a worsening status quo for all who don’t already own: “conveying windfall gains on housing market insiders, while burdening new entrants with increased debt […] creat[ing] a massive transfer of wealth upwards in both age and income terms.” (Schwartz & Seabrooke, 2008: 257)
Over the past decade, it’s also contributed to a surge in demand from housing investors.
Surging Demand from Housing Investors
Canada’s unusually deep level of state support in expanding access to mortgage debt goes a long way in helping to explain the country’s unusually fast-rate of decoupling of home prices and incomes. However, it fails to explain how prices have been pushed up to levels so thoroughly out of reach of most prospective homeowners.
According to the National Bank of Canada’s Housing Affordability Report, to qualify for a mortgage on a median-price home in late 2023, a household would need an annual income of at least $261,000 in the metropolitan area of Vancouver, $248,000 in Toronto, and $220,000 in Hamilton and Victoria. That’s 2.5 to 3 times higher than each areas’ median household income. And in a composite of the country’s ten largest metro areas, an annual household income of at least $190,000 is now needed to qualify for a mortgage on a median price home; more than double the median income of these regions.9 How have buyers been able to continue bidding up and buying housing at these prices?
Part of the answer lies in changes in who is actually buying. Surging prices have different consequences for different types of buyers. While they’ve made housing decreasingly affordable for prospective first-time buyers, they’ve also dramatically increased the wealth of those who already own housing, “super-charging” their bidding power. (Pomeroy, 2021)
On the one hand, this has supercharged the ability of homeowners to bid up the price of their next home when moving, especially when moving away from high-price areas like Toronto or Vancouver. The cascade effect this can have was brought to national attention during the 2020 pandemic when movers seeking larger homes outside of inner-cities helped to spread price escalation across the country. But increasingly importantly, price surges have also supercharged their demand for additional homes.
As their home values skyrocketed over the past decade, wealthy Canadians became increasingly willing and able to bid up and buy investment properties. Leveraging their homes and higher incomes to outbid prospective homeowners, investors dramatically increased their share of ownership of Canada’s housing stock. A wealth of recently released data sheds light on these trends.
Discussed below, census data reveals that between 2011 and 2021 the number of condo apartments and houses rented out as investment properties grew four times faster than Canada’s overall housing stock. Investors almost doubled their ownership of condo apartments and increased their ownership of houses by almost a third.
To be discussed in Part 2 of this series, data from the BoC and Teranet land registry services reveals owners of multiple properties have become an increasingly dominant buyer group over the past decade. Purchasing an increasing share of all housing put up for sale, they’re increasingly crowding out those trying to buy a home to live in. These trends are particularly advanced in Ontario, where investors have displaced first-time buyers as the largest buyer group, nearly doubling their share of purchases of all homes sold between 2011 and 2023. And across Canada, the share of all home sales purchased by investors notably soared by at least 50 percent between the onset of the pandemic and the spring of 2023, acquiring upwards of 30 percent of all housing bought with a mortgage by an individual as of spring 2023.
Mounting warnings from prominent financial and economic institutions are beginning to focus public attention on the negative outcomes of these trends.
In recent years, StatCan has drawn news headlines for its regular reporting of housing data documenting the large and expanding scale of investors ownership. (StatCan, 2022; StatCan, 2023; Gordon & Fontaine, 2023a; Gordon & Fontaine, 2023b) Their research finds these trends are producing “increased competition” in already tight real estate markets, making it more difficult for prospective homeowners to purchase a home. (StatCan, 2022)
The BoC is also focusing much attention on the issue through its repeated warnings that investors’ growing prominence in the housing market is contributing to, “strong demand relative to supply,” heightened “bidding pressures,” “rapid price increases,” and alarming “imbalances in prices.” In 2022, the BoC reported investors had become, “much more highly indebted than other types of homebuyers,” and were, “increasingly extracting equity from their existing properties to support new purchases,” adding to a “feedback loop” between rapid gains in house prices and the stronger demand for housing that investors generate.
In addition to exacerbating housing unaffordability, the BoC worries that investors’ outsized influence on the housing market could become ,“a source of instability for the financial system and the economy more broadly.” (Khan & Xu, 2022) Echoing the findings of extensive international research, (Lee et al, 2011; Allen et al, 2018; Garriga et al, 2023; Albanesi et al, 2022) the BoC warns investors tend to “amplify house price cycles” and “boom-bust cycles.”
These concerns have only grown in the context of higher interest rates. Between March 2022 and July 2023, the BoC increased the inter-bank interest rate from 0.25 percent to 5 percent, where it remains today. Home prices have become more volatile. There is little confidence they will resume sustained escalation in the near-term.
So long as interest rates remain relatively elevated, Canada’s “highly indebted” investors are disproportionately likely to face difficulties servicing their debt. When price declines appear likely, investors are disproportionately likely to sell. Viewing their housing as a means to accumulate wealth, and unrestrained by the manifold reasons owner-occupiers have for not wanting to sell their home, investors are, “more sensitive to shifts in market sentiment,” and more prone to sell en masse. Indeed, their propensity to amplify downturns through fire sales proved cataclysmic in the United States where, between 2005 and 2009, “the rise in mortgage defaults [was] driven to a large extent by real estate investors.” (Albensi et al, 2022)
Will Canada’s debt-driven and investor-driven decoupling of prices from local incomes come unhinged and crash in the near-term? Will the share of housing owned by multiple-property owners continue to grow in the long-run? The answer to these questions will depend largely on how governments choose to intervene. That, in turn, will depend on the public understanding of why and how they should do so.
The Geography of Investor Ownership
Until recently, it has been difficult to assess the full scale and scope of investor ownership because information on who owns Canada’s housing stock has remained fragmented and often challenging to access.
This is now changing. In 2017 StatCan was mandated to create a “comprehensive” database tracking residential property ownership through its new Canadian Housing Statistics Program (CHSP). In 2023, CHSP drew headlines when it released a dataset documenting investor ownership of housing in British Columbia (BC), Manitoba, Ontario, New Brunswick, Prince Edward Island (PEI), and Nova Scotia.10
CHSP defines a housing investor as, “an owner of at least one residential property that is not used as their primary place of residence.” These investment properties are typically either rented long-term, rented short-term through platforms like Airbnb, used as vacation homes, or left vacant. Importantly, CHSP excludes units such as basement suites or laneway houses if they are part of an owner-occupied property.
As of 2021, investors were found to own between 14 percent and 26 percent of all houses (single-detached, semi-detached, and row houses) in each province, and between 30 percent and 42 percent of condo apartments in BC, Manitoba, and Ontario.11 In future updates, CHSP is expected to expand its coverage to further provinces.
Recently built housing is being especially targeted. In BC, 49 percent of all condo apartment units completed over the previous five years have been acquired by investors. In Ontario, investors have bought up by far the highest share, 57 percent, attracted by the fact that housing built after November 2018 is the only type in which tenants are not protected by rent controls.
Table 1 – Investor Ownership of Housing in Select Provinces, as of 2021
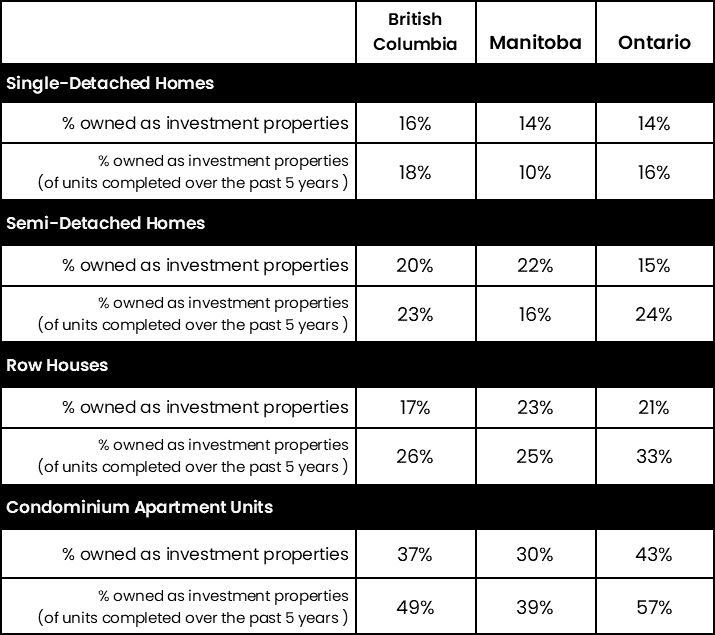
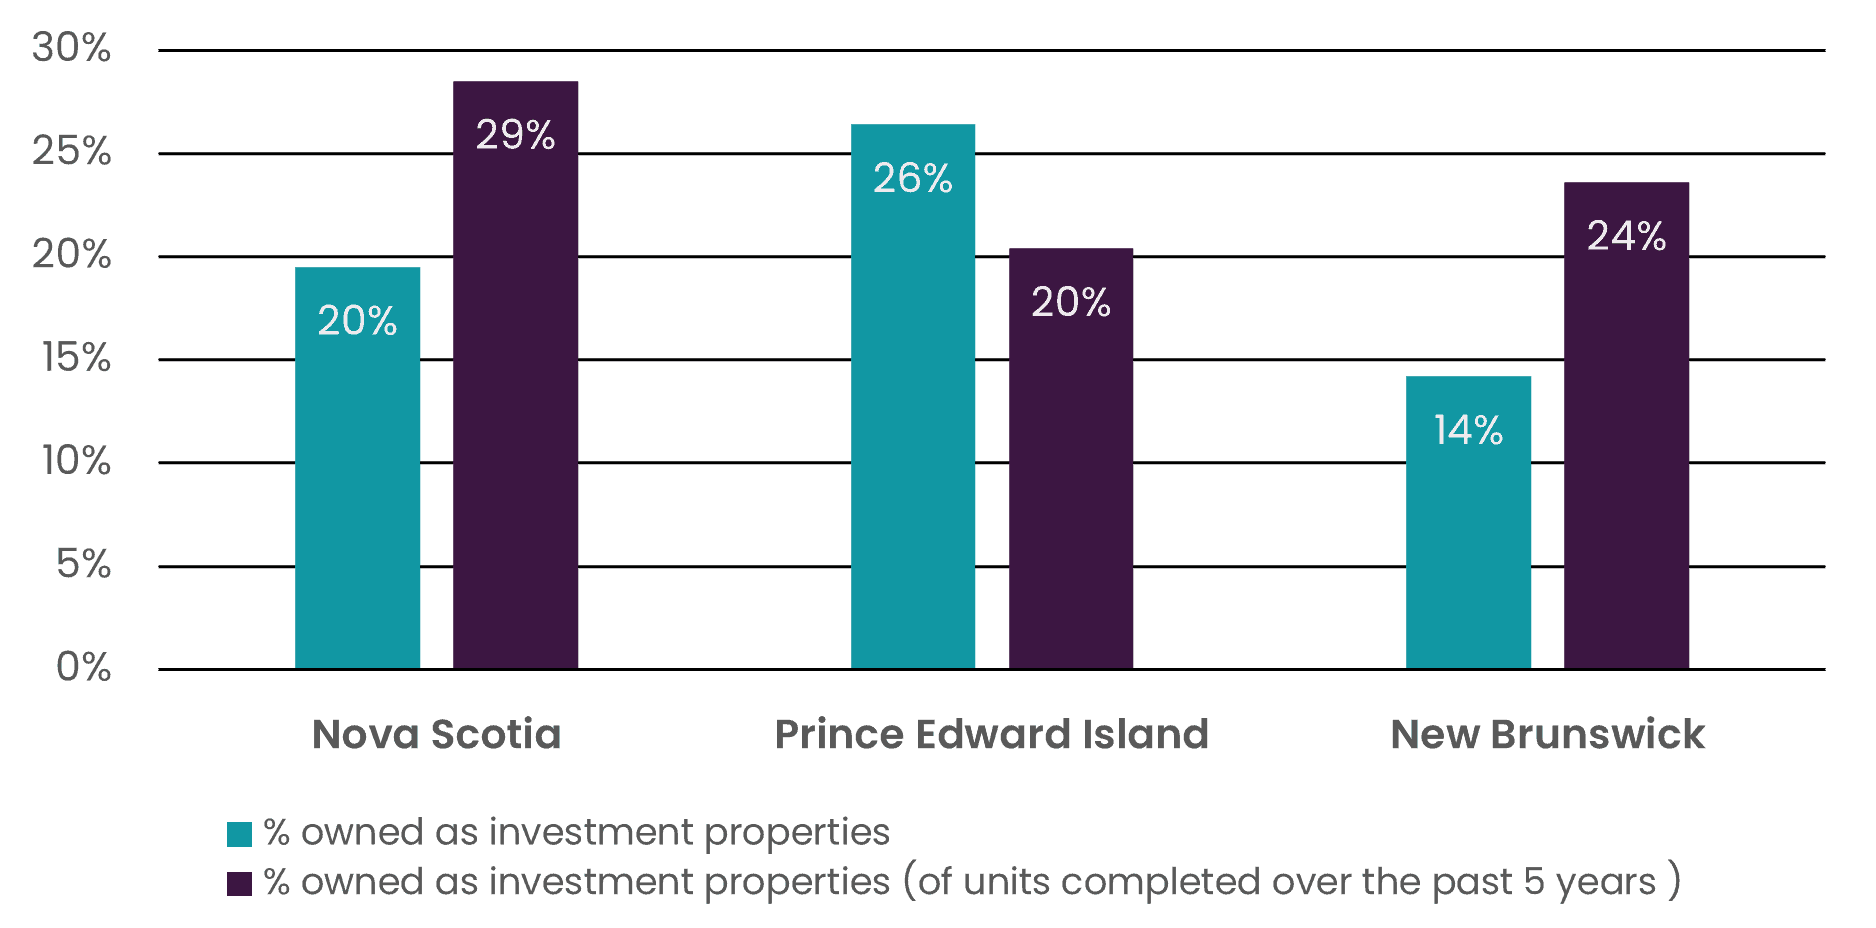
Chart 6 – Investor Ownership of Single-Detached Houses in the Maritimes, as of 2021
Similar patterns emerge across these provinces’ largest census metropolitan areas (CMAs), where investors typically own the majority of recently built condos, and 20 to 30 percent of recently built houses.
In BC, investment properties appear to be geographically widespread, with the province-wide share generally around or slightly above that of BC’s largest CMAs.
Table 2 – Investor Ownership of Condo Apartments and Houses (single-detached, semi-detached and row) in BC’s Largest Metropolitan Areas, as of 2021

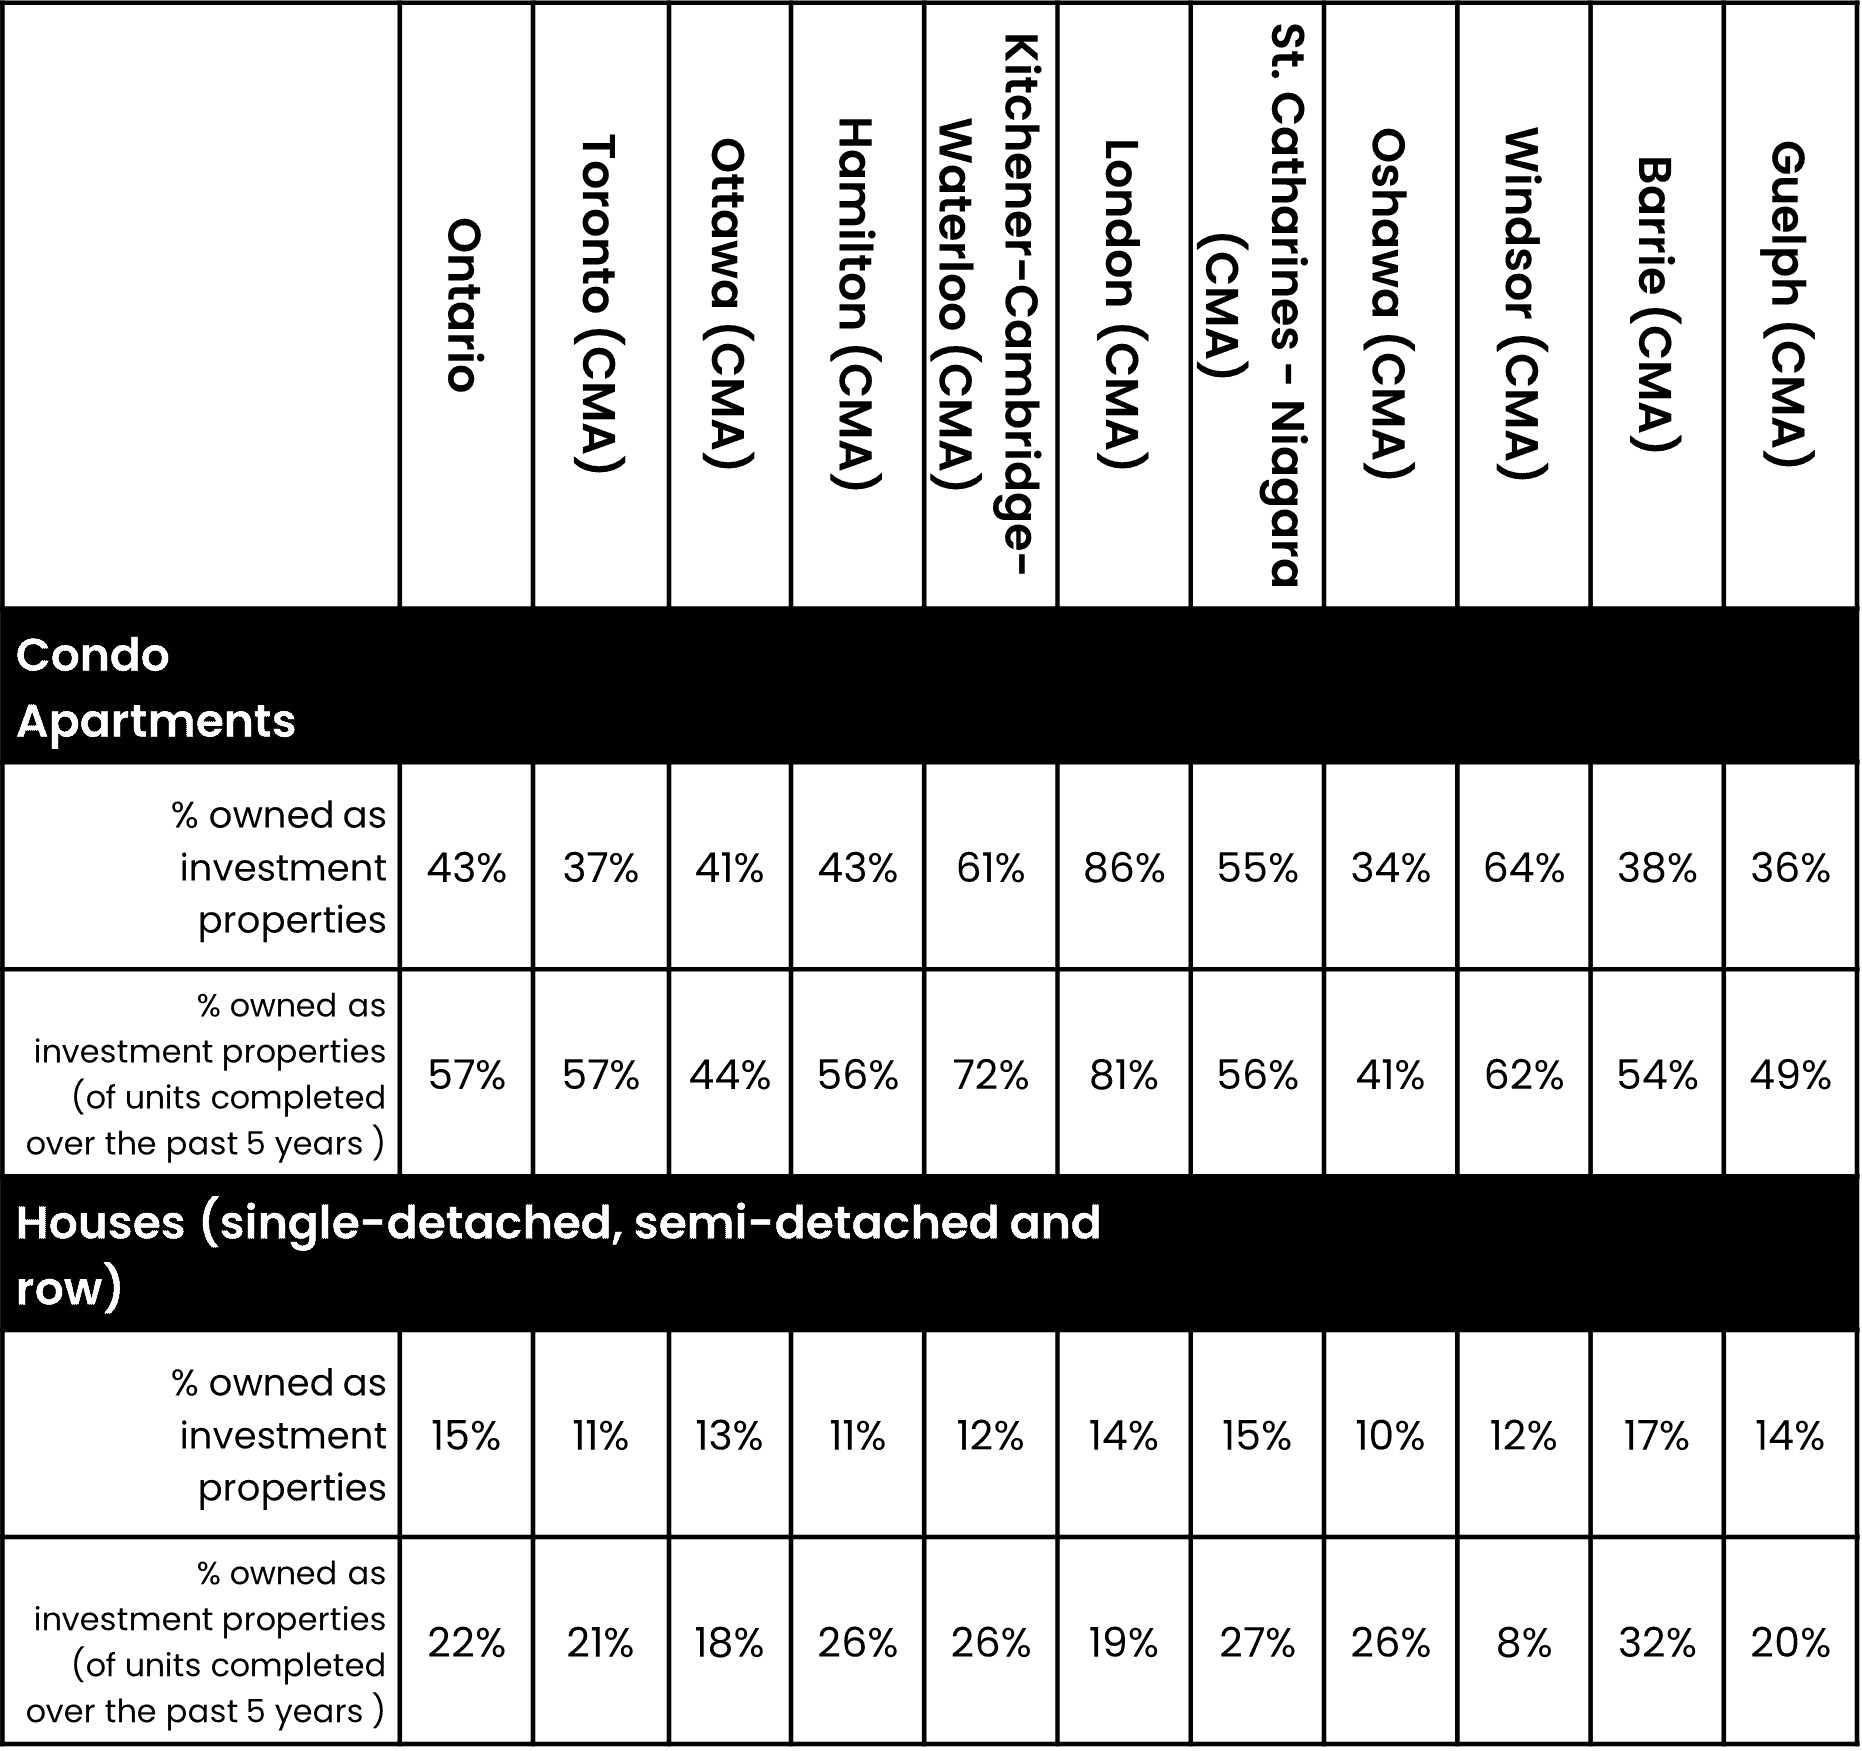
In Ontario, they’re similarly widespread, though the concentration of investor ownership of condo apartments is notably variable — ranging from just over one-third in Oshawa to just under two-thirds of condo apartments in Windsor, to 86% in London (where local peculiarities of the rental apartment market have been identified as contributing to its outlier status). (Lauster & Von Bergmann, 2023)12
Table 3 – Investor Ownership of Condo Apartments and Houses (single-detached, semi-detached and row) in Ontario’s Largest Metropolitan Areas, as of 2021
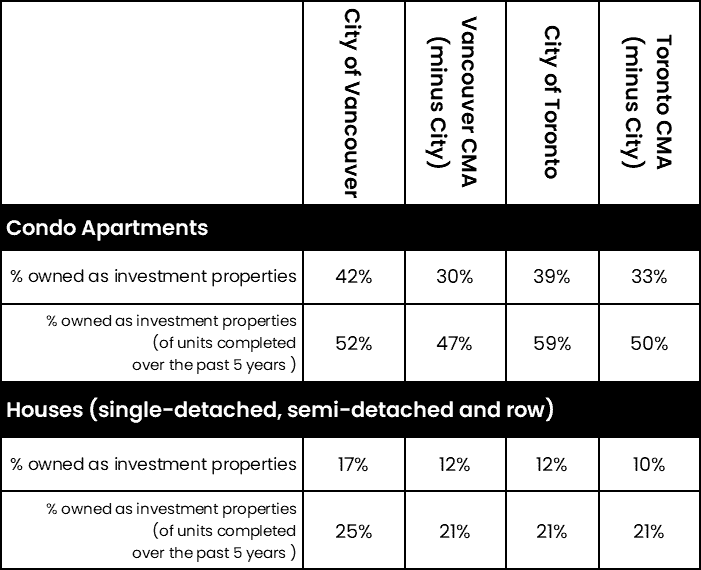
Investor ownership is also notably concentrated in the core of these provinces’ largest urban areas. Whereas in the City of Vancouver 42 percent of condo apartments and 17 percent of houses are investment properties, across the suburbs making up the rest of the Vancouver CMA investors own 30 percent of condo apartments and 12 percent of houses. And whereas in the City of Toronto, the share is 39 percent and 12 percent respectively, across the Toronto CMA suburbs investor ownership is 33 percent and 10 percent respectively.
Table 4 – Investor Ownership of Condo Apartments and Houses (single-detached, semi-detached and row) in Cities vs Suburbs of Vancouver and Toronto, as of 2021
How Has Investor Ownership Evolved?
To track longer-term changes in the number of investment properties, CHSP data is unhelpful, as it goes back no more than a few years.
Since 2006, StatCan’s Census and National Household Survey (NHS) have tracked the tenure (i.e. rented or owner-occupied) of all single-detached, semi-detached, and row houses. In 2011, they also began tracking condo apartments.
This analysis tracks changes in the number of rented condo apartments and houses as a proxy for changes in the number owned as investment properties. While the former accounts for the vast majority of the latter, it is important to recognize it does not account for investment properties left unrented (whether vacant or used as a vacation home) or rented short-term through platforms like Airbnb. In this analysis, houses with occupied secondary suites such as basement units (i.e ‘duplexes’) are excluded. Consequently all rented houses documented here are non-owner-occupied investment properties.
Between 2006 and 2011,13 the number of houses rented out as investment properties across Canada increased by a modest 8.5 percent, growing at roughly the same pace as the overall stock of occupied houses. Between 2011 and 2021, the number shot up by 31 percent, from 980,000 to 1.3 million, growing at a rate 3.4 times faster than the total stock of occupied houses.
Chart 7 – Number of Houses Rented Out by Province
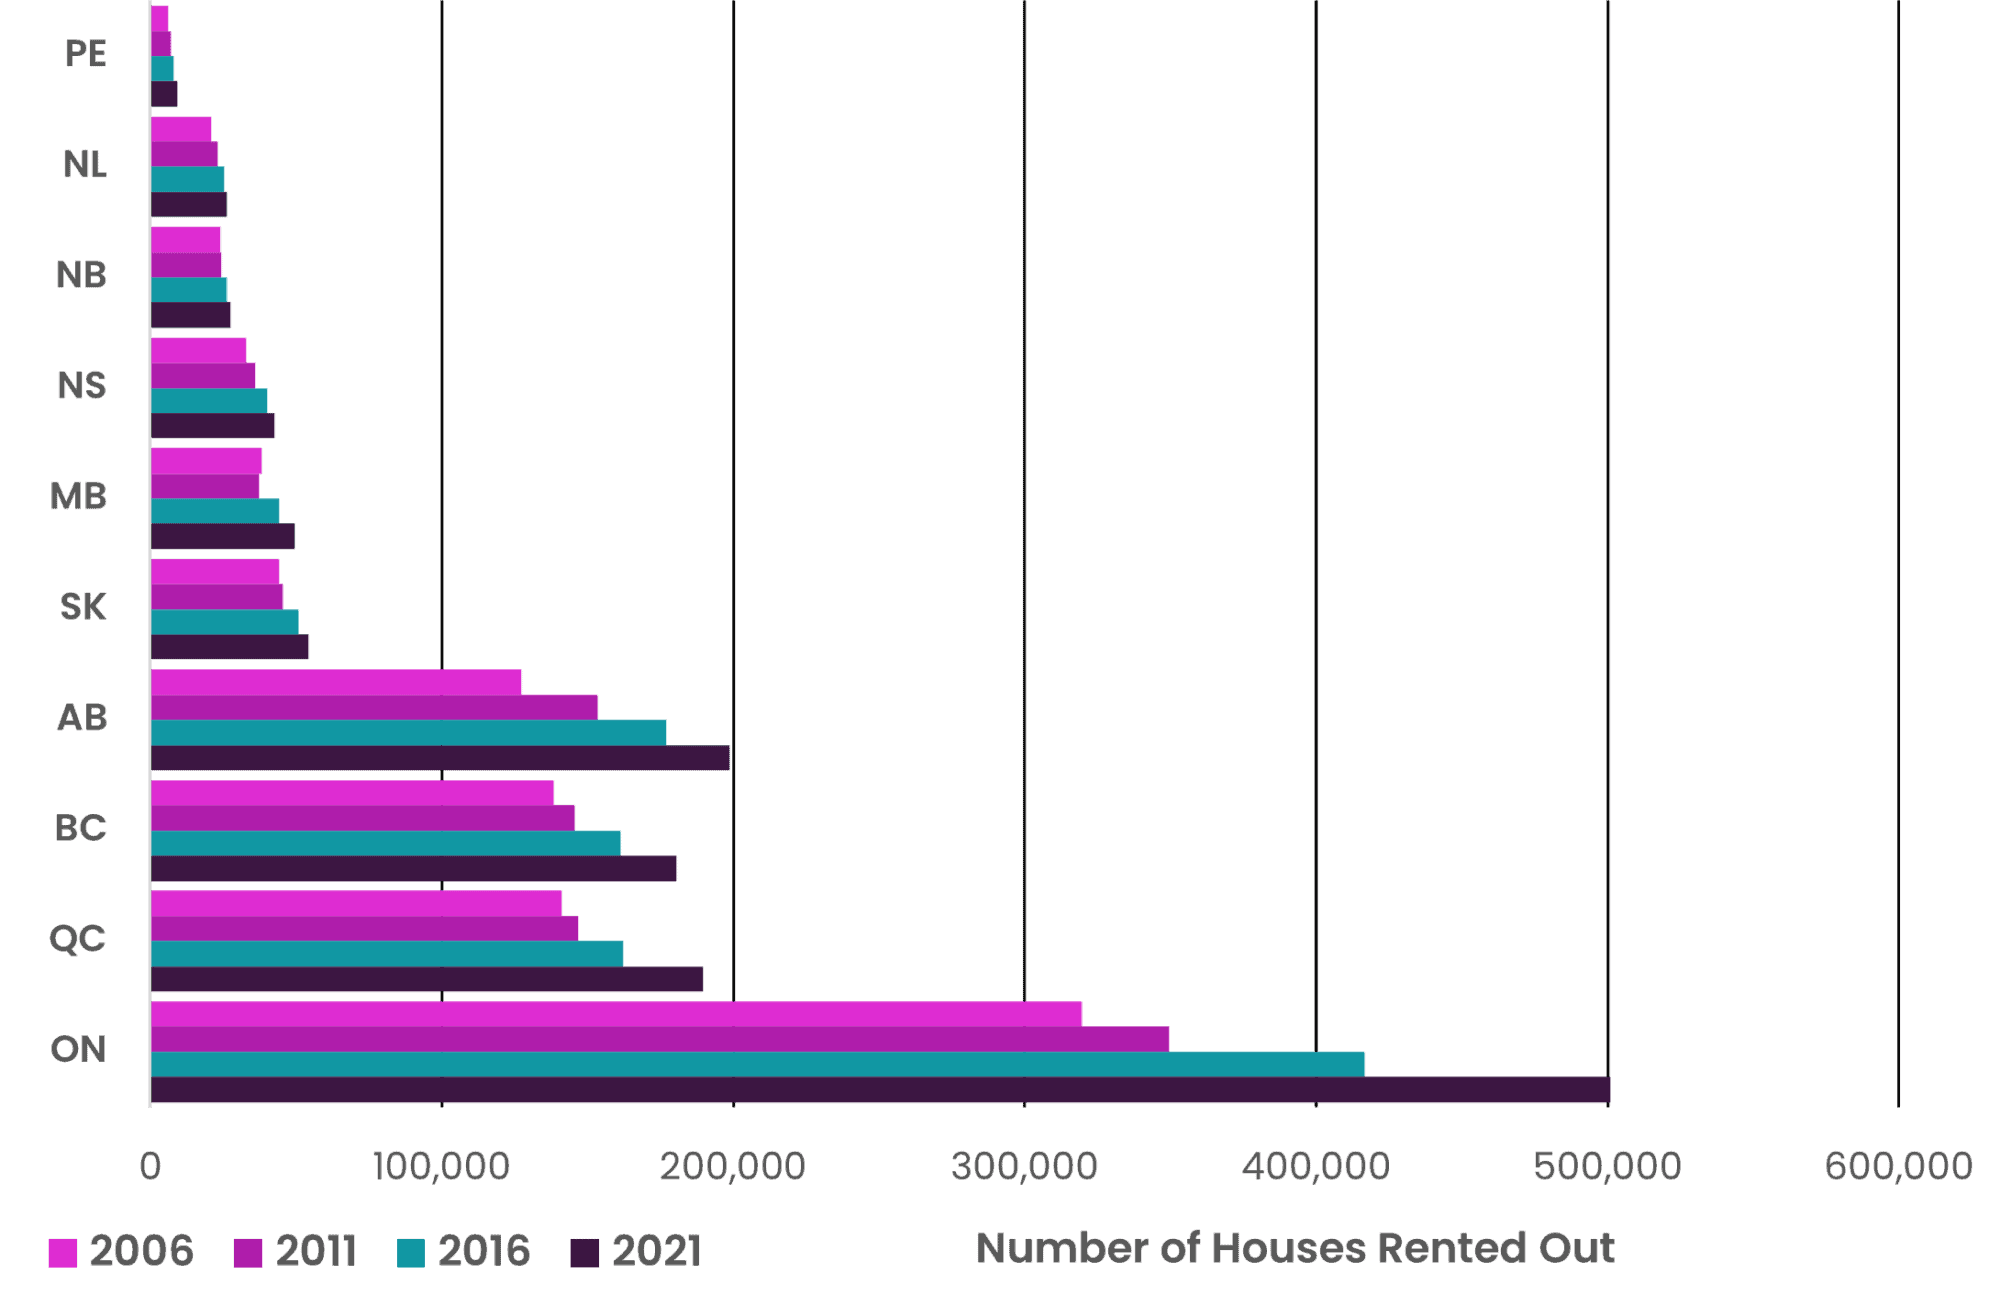
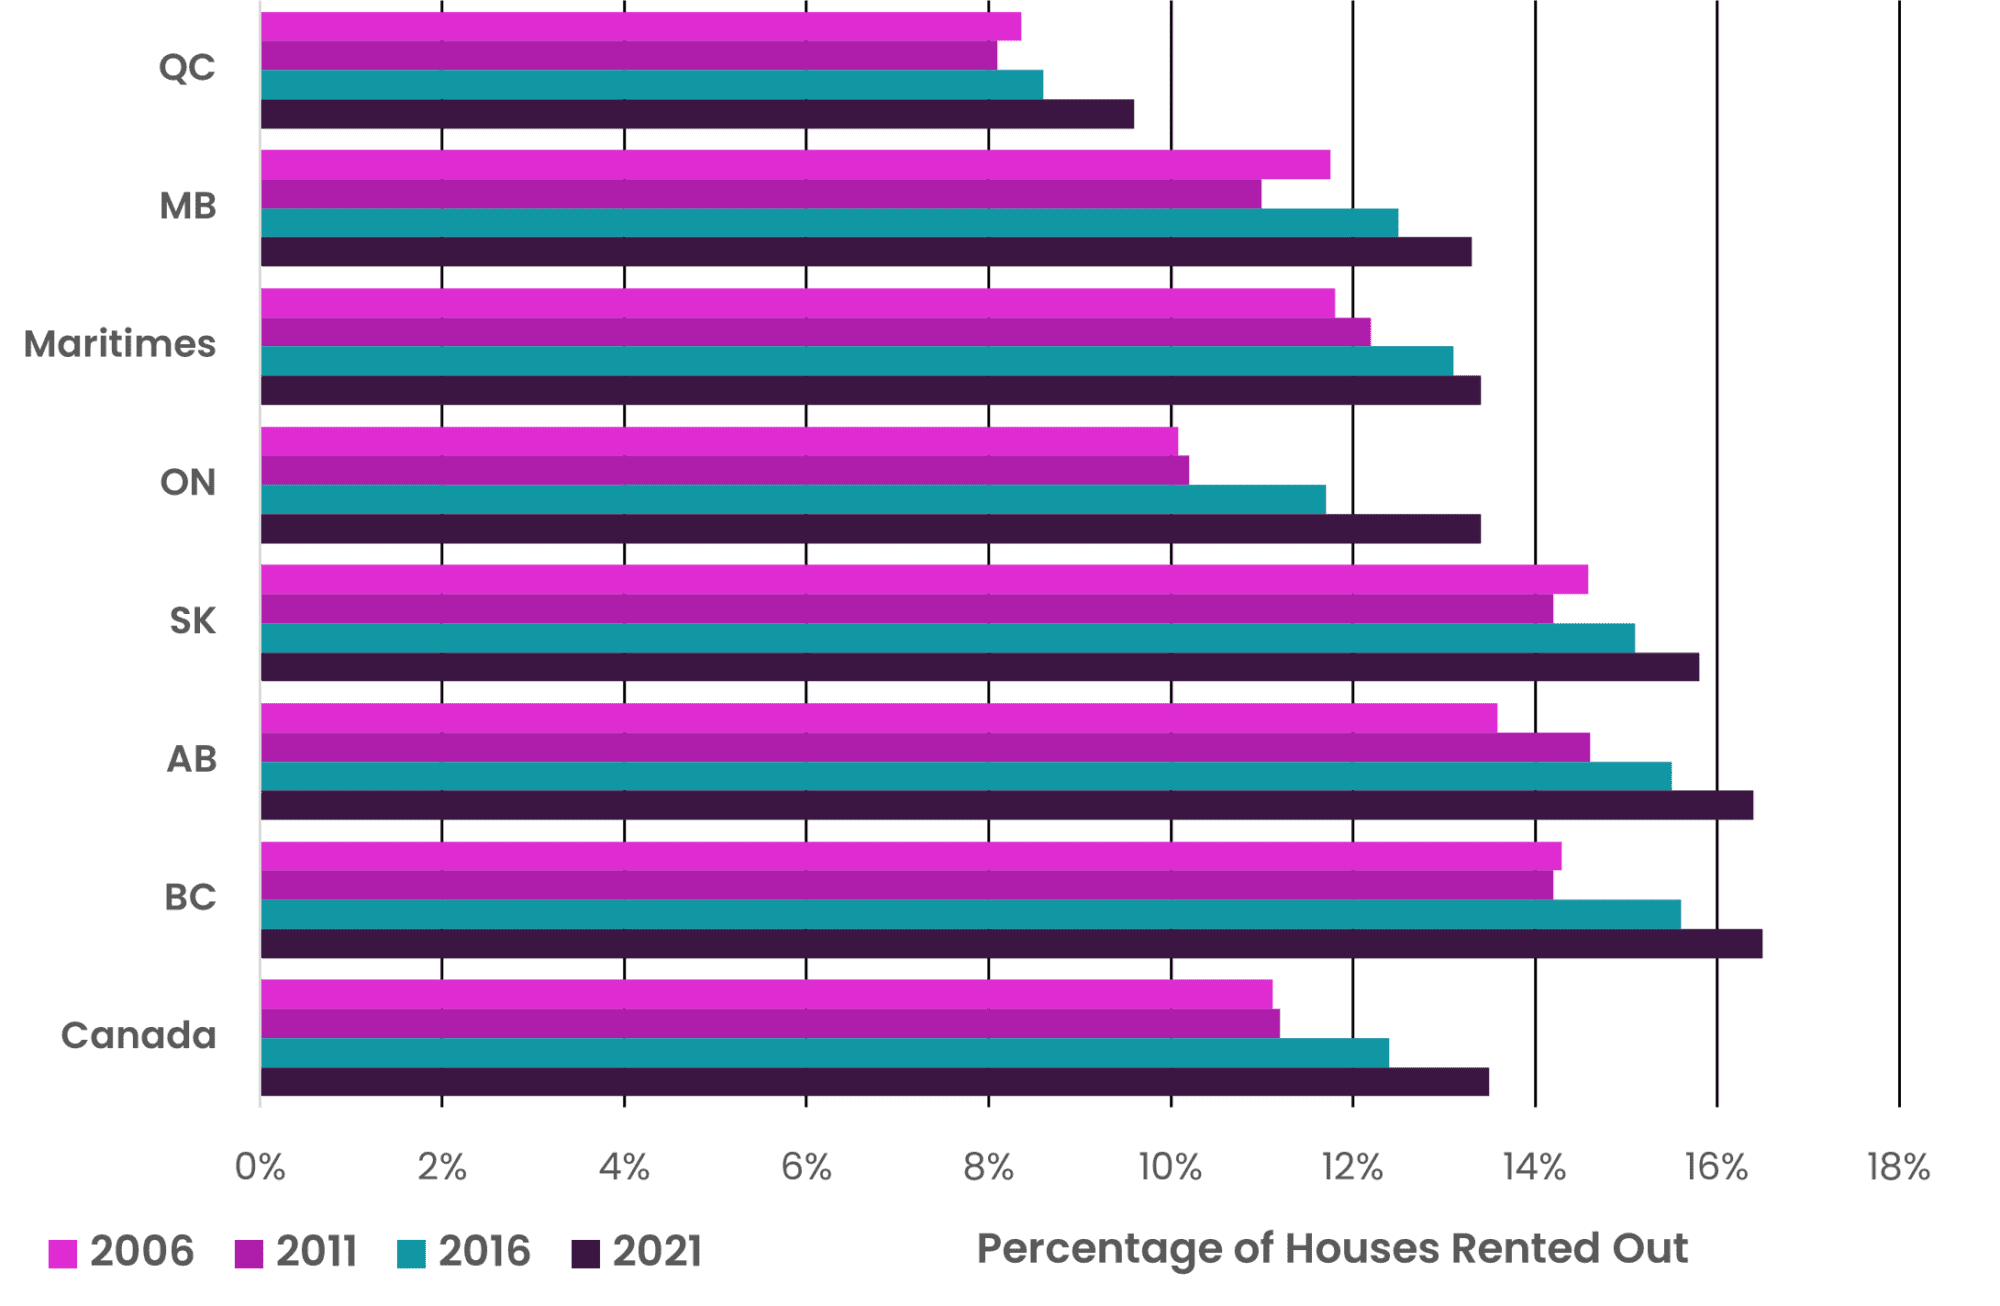
Accordingly, the share of houses being rented out rose by 21 percent, from 11.2 to 13.5 percent of all occupied houses. Ontario experienced by far the fastest rate of growth (31 percent).
Chart 8 – Percentage of Houses Rented Out by Province
Between 2011 and 2021, the number of condo apartment units rented out as investment properties across Canada nearly doubled,14 from 378,000 to 681,000, growing just under twice the rate of the overall stock of occupied condo apartments.
Chart 9 – Number of Condo Apartments Rented Out by Select Provinces
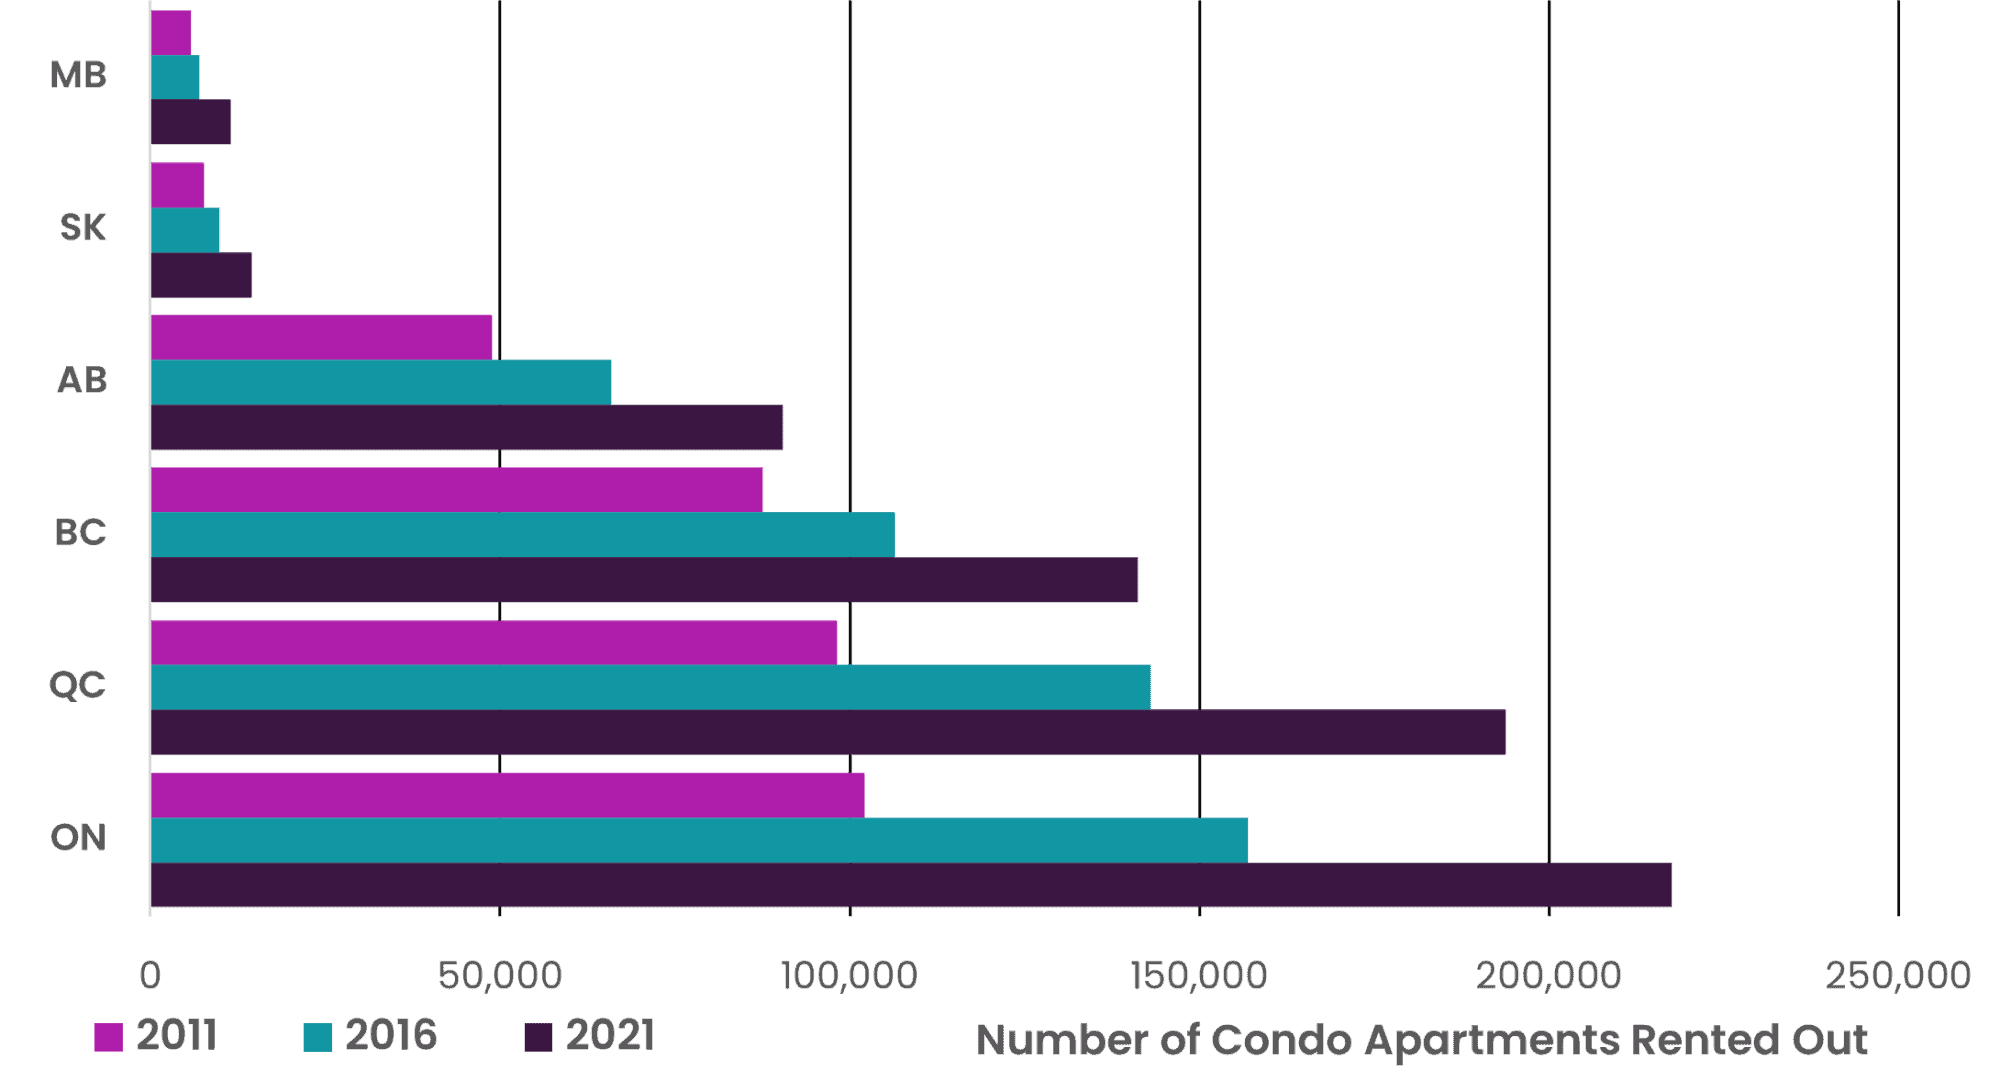
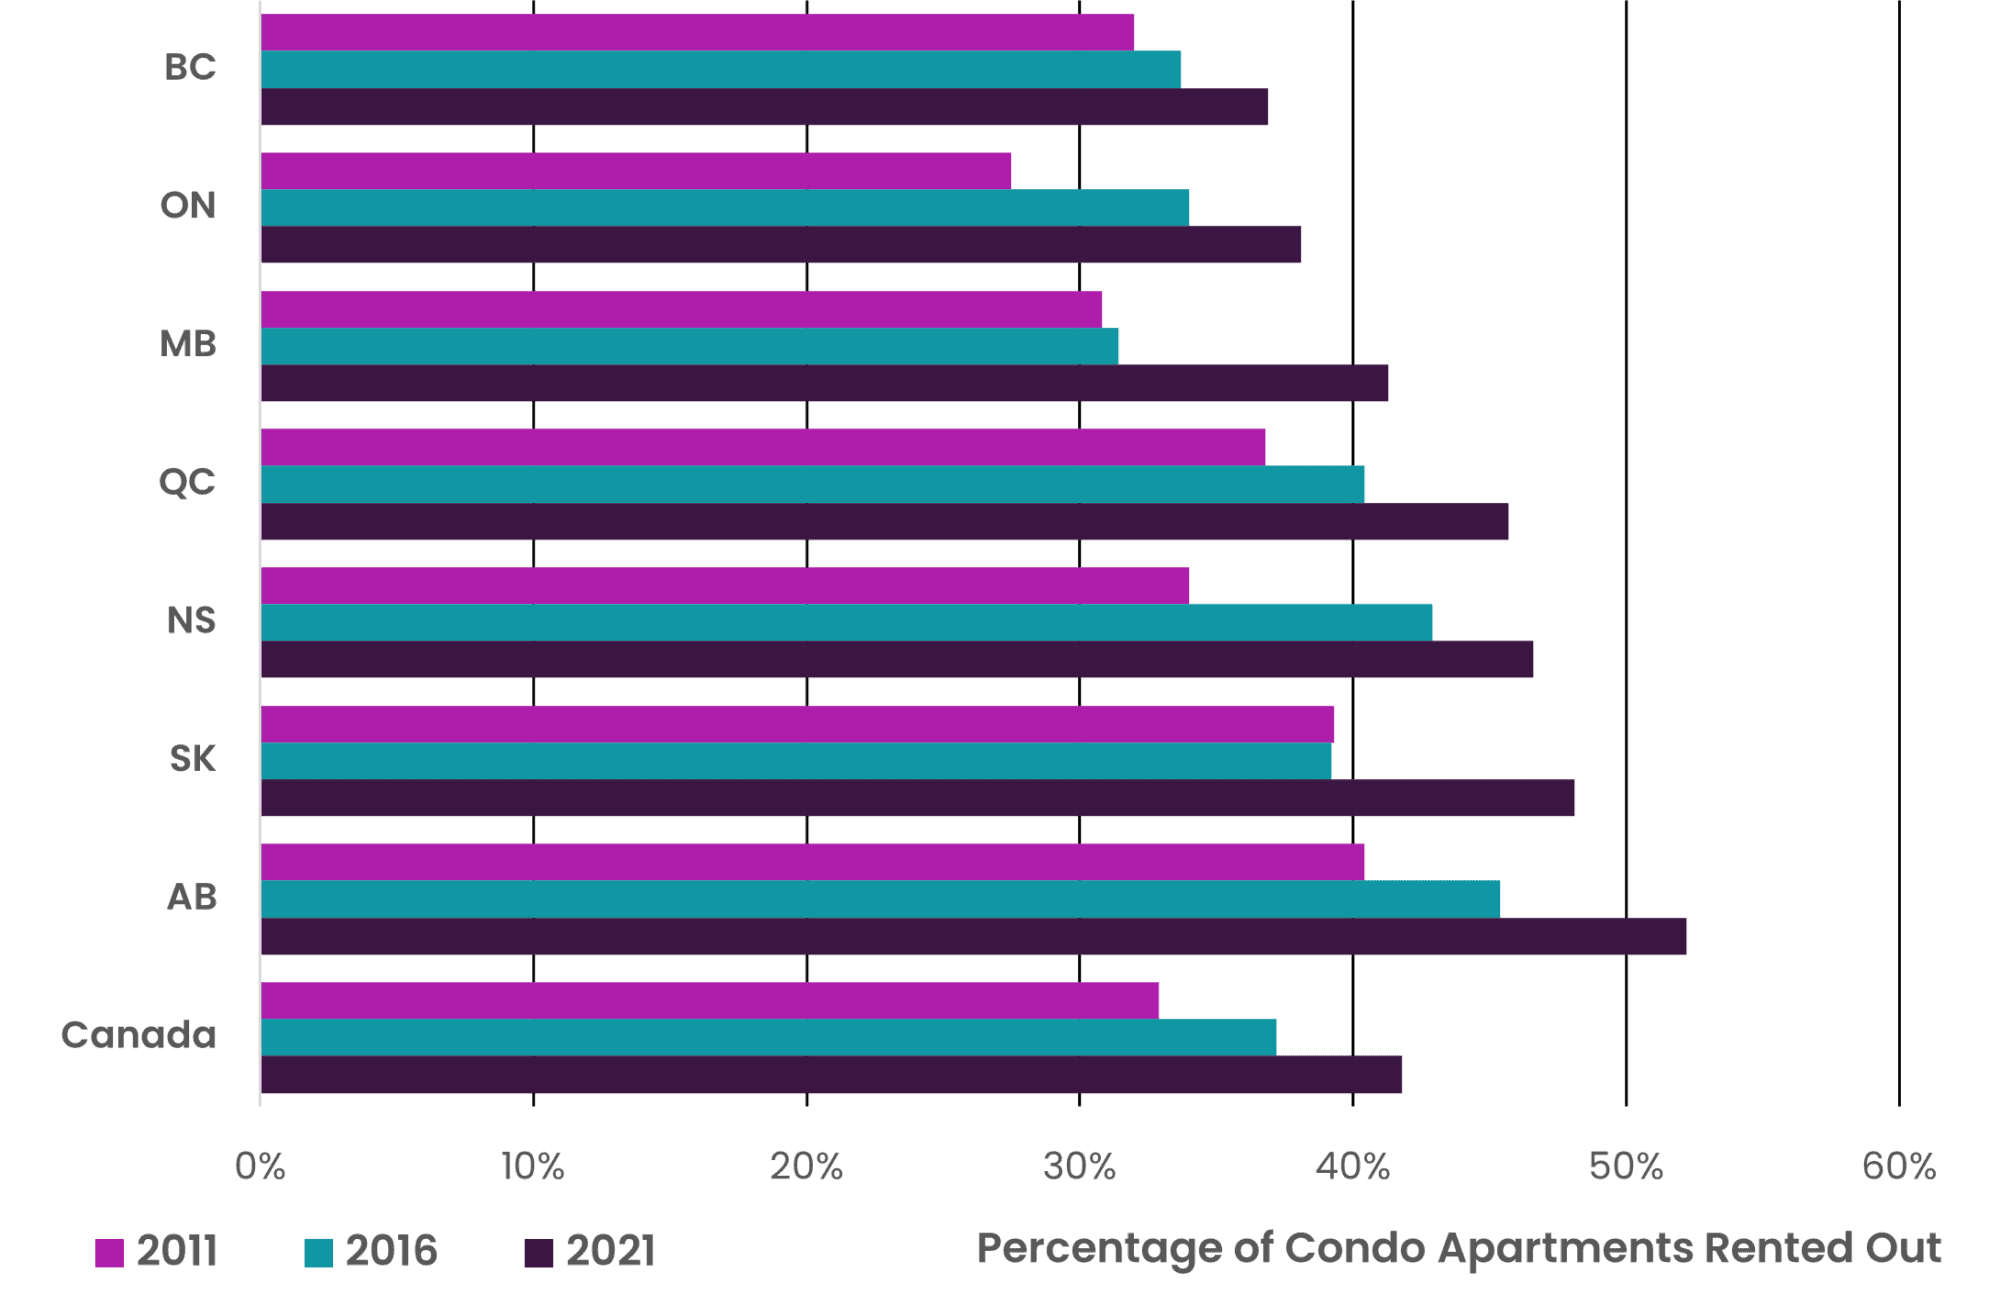
Accordingly, the share of condo apartments being rented out rose by 27 percent, from 33 to 42 percent of all occupied condo apartments. Again, Ontario experienced by far the fastest rate of growth (39 percent).
Chart 10 – Percentage of Condo Apartments Rented Out by Select Provinces
What Types of Housing are Investors Buying
That investors have acquired especially high concentrations of newer housing and condo apartments has important implications and bears closer scrutiny.
First, it is notable that in every area studied, investors are above all targeting the most affordable type of housing for sale (condo apartments). This is especially true in Ontario, where CHSP data reveals investors’ share of condo apartments is almost three times higher than their share of houses. It is slightly over twice as high in the other provinces studied. This will be particularly concerning for those trying to buy their first home.
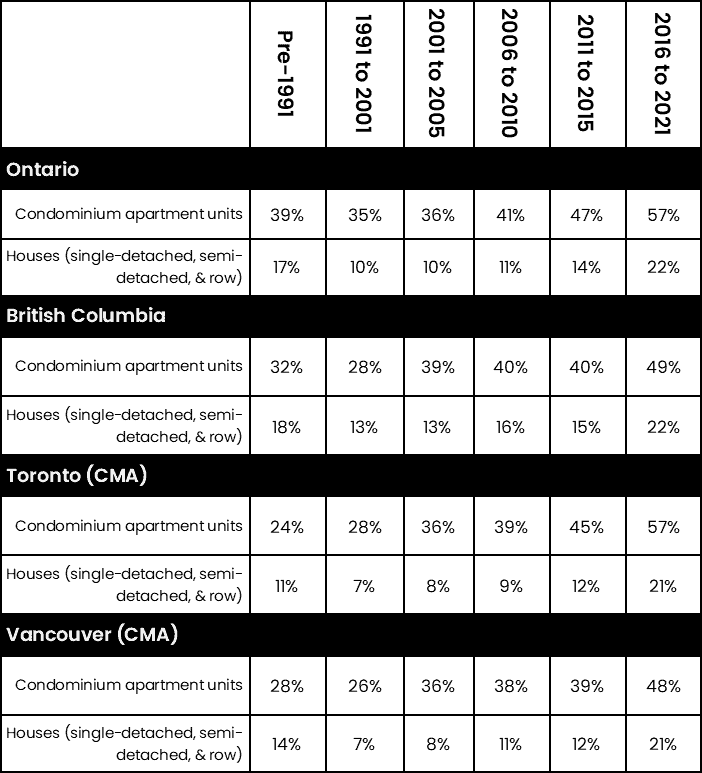
Second, it is notable that in every area studied, investors typically own a substantially larger share of newer housing than older housing. Using CHSP data, Table 5 reveals the percentage of housing units owned as investment properties in 2021, based on the period in which they were completed.
Table 5 – Investor Ownership of Condo Apartments and Houses (single-detached, semi-detached and row) in Ontario, BC, Toronto CMA, and Vancouver CMA by Period Built, pre-1991 to 2021
This raises an important question: are investors mostly buying newly built properties, but then selling them to owner-occupiers after holding them for a number of years?
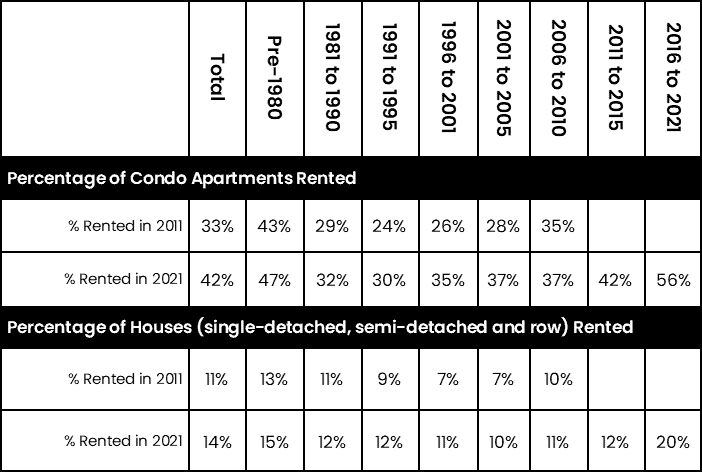
As table 6 reveals, between 2011 and 2021 this is not the case. Over the past decade, investors increased their share of condo apartments and houses built in each and every period. Whether it was aging pre-First World War era stock, sprawling post-war stock, or 21st century stock, investors bought more units than they sold. Both in the sales rooms for new housing and the re-sale market, prospective homeowners are being increasingly out bid and crowded out.
Table 6 – Percentage of Condo Apartments and Houses (single-detached, semi-detached and row) Rented Out by Period Built, Canada, 2011 vs. 2021
The fact that investors are buying up such a large share of recently built housing (in some cities a majority) raises serious doubts about the extent to which policies focused on spurring market-rate housing supply can be expected to make that housing “attainable.” In the absence of major policy changes, the evidence suggests much of this housing will ultimately be attained by wealthy Canadians trying to grow their portfolios, rather than ordinary Canadians trying to buy a home. These trends are not inevitable. They are a choice.
Forthcoming analysis in this series will examine how the rise of investor ownership is transforming Canada’s rental housing system, and what policy actions can be taken now to address these trends and advance the right to permanently affordable housing. To reduce price escalation, a number of demand-side policies are recommended: taxing and restricting access to finance for those buying investment properties, and extending rent control to all units; new and old, occupied and vacant. To forge longer-term solutions, a number of supply-side policies are recommended: supporting large-scale development and acquisition of non-profit housing, and requiring all new developments accommodate residents with a mix of incomes.
Notes
- Source for Canada-wide benchmark home price is MLS Home Price Index. Source for dwelling counts and population is StatCan’s Census and National Housing Survey between 2006 and 2016, and between 2016 and 2022 they are based on quarterly data from StatCan’s Table: 36-10-0688-01 and Table: 17-10-0009-01. ↩︎
- This is further underlined when one considers recent growth in the number of unoccupied homes (a broad category that includes vacation homes, short-term rentals, vacant homes, and homes listed for sale or for rent), which aren’t accounted for in this chart. In recent years, the stock of unoccupied dwellings has grown from 1.14M in 2016 to 1.26M in late 2023, consistently accounting for around 1 out of every 13 homes. ↩︎
- Of course, underlying these Canada-wide trends there are local variations, requiring area-specific assessments. ↩︎
- For a similar conclusion, see the TD Bank’s report “Digging Beneath The Surface: Is Housing Perpetuating A Wealth Divide in Canada?” ↩︎
- Source for household debt as % of net disposable income is OECD. Source for price-to-income ratio is OECD, and equals: (a) an index of the nominal sales price of newly built and existing dwellings, divided by; (b) the nominal disposable income per head. ↩︎
- Today, a parade of repentant neoliberals have joined Turner in his belated conclusion. Notably, in his recent book diagnosing The Crisis of Democratic Capitalism, Martin Wolf, Chief Economics Commentator for the Financial Times, assigns much of the blame squarely on four decades of financialization. “Financialization”, he argues, has proven to be “far more a vehicle for rent extraction than productive investment”, with “little of this expansion in financial balance sheets…financing fresh investment” (2023: 149, 152). ↩︎
- Source for Canada-wide benchmark home price is MLS Home Price Index. Source for mortgage lending rate is CMHC. ↩︎
- Source for price-to-income ratio is OECD, and equals: (a) an index of the nominal sales price of newly built and existing dwellings, divided by; (b) the nominal disposable income per head. Mortgage debt-to-income ratio is calculated using StatCan Table 38-10-0238-01. ↩︎
- The National Bank of Canada’s Housing Affordability Report “measures housing affordability in 10 major census metropolitan areas (CMAs) and summarizes the results in a weighted-average composite of the 10 CMAs” (National Bank, November 2023: 4). ↩︎
- In future updates, CHSP is expected to expand its coverage to further provinces.
↩︎ - Single-detached houses account for around 80 percent of all houses in BC, Manitoba, and Ontario, and around 90 percent in the Maritime Provinces. In the Maritimes, condo apartments, semi-detached houses, and row houses collectively represent only a small portion of housing, adding up to no more than a tenth of the total stock. Consequently, they’ve been excluded from these counts. ↩︎
- A thoughtful study by Nathan Lauster indicates that, while a substantial portion of the small stock of apartment units in London (and potentially Kitchener-Cambridge-Waterloo) are legally structured as condominiums, they tend to be operated more like purpose-built rentals. Lauster argues CHSP should not include such apartments under the category “investment condos”, suggesting their tenants typically enjoy the stability associated with purpose-built rental apartments. At the same time, there’s evidence their tenants are more vulnerable to eviction than in purpose-built rentals. More research is needed to identify how many hybrid condos/purpose-built rentals exist and their tenants’ experiences. A preliminary estimate suggests in the Toronto area they represent less than 1% of condo apartments. ↩︎
- Since 2006, Census and NHS data has distinguished between single-unit houses (ie detached, semi-detached, and row houses) and houses with two units (ie ‘duplexes’). The latter include secondary suites such as basement units. In this analysis, the former are termed “houses”. Consequently, in this analysis all rented houses can be considered wholly non-owner-occupied investment properties. ↩︎
- This analysis sums Census and NHS data on condo apartments in buildings with “5 or more stories” and “fewer than five stories”. ↩︎
Data Sources
Click to expand for data sources of charts and tables.
Chart 1 – Source for Canada-wide benchmark home price is MLS Home Price Index. Source for dwelling counts and population is Statistics Canada’s Census and National Household Survey between 2006 and 2016, and between 2016 and 2022 they are based on quarterly data from Statistics Canda Table: 36-10-0688-01 and Table: 17-10-0009-01.
Chart 2 – OECD Data, National Accounts at a Glance, Household Debt, 2022 or latest data available: https://data.oecd.org/hha/household-debt.htm
Chart 3 – OECD Data, National Accounts at a Glance, Housing Prices, nominal house prices / rent price, 2015 = 100, Q4 2023 or latest data available: https://data.oecd.org/price/housing-prices.htm?context=OECD
Chart 4 – Source for Canada-wide benchmark home price is MLS Home Price Index. Source for mortgage lending rate is CMHC, Statistics Canada Table: 34-10-0145-01 (formerly CANSIM 027-0015)
Chart 5 – Source for price-to-income ratio is OECD, and equals: (a) an index of the nominal sales price of newly built and existing dwellings, divided by; (b) the nominal disposable income per head. Mortgage debt-to-income ratio is calculated using Statistics Canada Table 38-10-0238-01
Chart 6 – Statistics Canada, Investment status of residential properties, Table: 46-10-0070-01
Chart 7-10 – For 2006 Data: Statistics Canada Catalogue no. 97-554-XCB2006021; For 2011 data: 2011 National Household Survey Table: 99-014-X2011026; For 2016 Data: Statistics Canada Catalogue no. 98-400-X2016221; For 2021 data: Table: 98-10-0234-01.
Tables 1-5 – Statistics Canada, Investment status of residential properties, Table: 46-10-0070-01
Table 6 – For 2011 data: 2011 National Household Survey Table: 99-014-X2011026; For 2021 data: Table: 98-10-0234-01.
References
Click to expand for a full list of references cited in this article.
Aalbers, M (2016) The Financialization of Housing: A political economy approach, Routledge: London
Aalbers M, Hochstenbach C, Bosma J, Fernandez R, (2021) “The Death and Life of Private Landlordism: How Financialized Homeownership Gave Birth to the Buy-To-Let Market,” Housing, Theory and Society, 38(5), pp. 541-563
Albanesi S, DeGiorgi G, Nosal J, (2022) “Credit Growth and the Financial Crisis: A new narrative,” Journal of Monetary Economics, 132, pp. 118-139
Al Mallees N, (Dec 19, 2023), “Temporary residents helped drive record growth in Canada’s population in the third quarter,” The Globe and Mail. Available: https://www.theglobeandmail.com/canada/article-statistics-canada-reports-record-population-growth-in-third-quarter/
Allen, Marcus T, Rutherford J, Rutherford R, Yavas A, (2018) “Impact of Investors in Distressed Housing Markets,” The Journal of Real Estate Finance and Economics, 56, pp. 622-652.
Anenberg E & Ringo D, (June 2022), “Volatility in Home Sales and Prices: Supply or Demand?” Board of Governors of the Federal Reserve Finance and Economics Discussion Series. Available: https://www.federalreserve.gov/econres/feds/volatility-in-home-sales-and-prices-supply-or-demand.htm
Arundel, R, (2017) “Equity Inequity: Housing Wealth Inequality, Inter and Intra-generational Divergences, and the Rise of Private Landlordism,” Housing, Theory and Society, 34(2), pp. 176-200.
Arundel, R & Ronald, R, (2021) “The false promise of homeownership- Homeowner societies in an era of declining access and rising inequality,” Urban Studies, 58(6), pp. 1120–1140.
August, M, (2020) “The financialization of Canadian multi- family housing: From trailer to tower,” Journal of Urban Affairs, 42: 975–997.
August M, Cohen D, Rosenman E, (2023) “Walls of capital: quantitative easing, spatial inequality, and the winners and losers of Canada’s pandemic-era housing market,” Cambridge Journal of Regions, Economy and Society, 16(1), pp. 225–238
Bangham, G (2019) Game of Homes: The rise of multiple property ownership in Great Britain, Resolution Foundation
Bank of Canada, (2022) “Financial System Review— 2022,” Bank of Canada. Available: https://www.bankofcanada.ca/2022/06/financial-system-review-2022/
Barlow S, (April 20, 2023) “Daily roundup of research and analysis from The Globe and Mail’s market strategist Scott Barlow,” Globe and Mail. Available: https://www.theglobeandmail.com/investing/markets/inside-the-market/article-scotiabank-analyst-reveals-top-picks-in-the-yield-heavy-energy/
Better Dwelling, (July 20, 2022) “Canada’s Housing Supply Has Outpaced Household Formation For Two Decades: BMO,” Better Dwelling. Available: https://betterdwelling.com/canadas-housing-supply-has-outpaced-household-formation-for-two-decades-bmo/
Beaudry P, (November 2021) “Financial stability through the pandemic and beyond,” Bank of Canada. Available: https://www.bankofcanada.ca/2021/11/financial-stability-through-the-pandemic-and-beyond/
Byrne, M (2020) “Generation rent and the financialization of housing: a comparative exploration of the growth of the private rental sector in Ireland, the UK and Spain”, Housing Studies 35(4), pp. 743-765
Christophers B, (2023) “How and Why U.S. Single-Family Housing became an Investor Asset Class,” Journal of Urban History, 49(2), pp. 430–449
Doling J & Ronald R, (2012) “Meeting the income needs of older people in East Asia: Using housing equity,” Ageing and Society, 32(3), pp. 471–490
Fernandez R, & Aalbers M, (2016) “Financialization and Housing: Between Globalization and Varieties of Capitalism,” Competition & Change, 20(2), pp. 71–88
Fields D, (2022) “Automated landlord: Digital technologies and post-crisis financial accumulation,” EPA: Economy and Space, 54(1), pp. 160–181
Forrest R & Hirayama Y, (2018) “Late home ownership and social re-stratification,” Economy and Society, 47(2), pp. 257-279.
Garriga C, Pedro G, Athena T, (2023) “The Economic Effects of Real Estate Investors,” Real Estate Economics, 51, pp. 655–85
Geng N, (July 2018) “Fundamental Drivers of House Prices in Advanced Economies,” IMF Working Paper No. 2018/164. Available: https://www.imf.org/en/Publications/WP/Issues/2018/07/13/Fundamental-Drivers-of-House-Prices-in-Advanced-Economies-46053
Gordon J & Fontaine J, (2023a) “Residential real estate investors and investment properties in 2020,” Statistics Canada. Available: https://www150.statcan.gc.ca/n1/pub/46-28-0001/2023001/article/00001-eng.htm
Gordon J & Fontaine J, (2023b) “A profile of residential real estate investors in 2020,” Statistics Canada. Available: https://www150.statcan.gc.ca/n1/pub/46-28-0001/2023001/article/00002-eng.htm
Hochstenbach C & Aalbers M, (2023) “The uncoupling of house prices and mortgage debt: towards wealth-driven housing market dynamics,” International Journal of Housing Policy, DOI: 10.1080/19491247.2023.2170542
Igan D, Kohlscheen E, Rungcharoenkitkul P, (March 2022) “Housing market risks in the wake of the pandemic,” BIS Bulletin No 50. Available: https://www.bis.org/publ/bisbull50.pdf
Jordà O, Schularick M, Taylor A, (2016) “The great mortgaging: housing finance, crises and business cycles,” Economic Policy, 31(85), pp. 107–152
Kadi J, Hochstenbach C, Lennartz C, (2020) “Multiple property ownership in times of late homeownership: a new conceptual vocabulary,” International Journal of Housing Policy, 20(1), pp. 6-24
Khan M & Xu Y, (2022) “Housing demand in Canada: A novel approach to classifying mortgaged homebuyers,” Bank of Canada Staff Analytical Note No. 2022-1. Available: https://www.bankofcanada.ca/2022/01/staff-analytical-note-2022-1/
Lauster N & Von Bergmann J, (2023) “Investing in Definitions and Framing” Home: Free Sociology!. Available: https://homefreesociology.com/2023/02/21/investing-in-definitions-and-framing/#more-8296
Lee A, Tracy J, van der Klaauw W, (2011) “Real estate investors, the leverage cycle, and the housing market crisis,” Staff Reports 514, Federal Reserve Bank of New York
Mian A & Sufi A, (2015) House of Debt, University of Chicago Press: Chicago
OECD, (July 2022) “Housing Taxation in OECD Countries,” OECD Tax Policy Studies. Available: https://www.oecd-ilibrary.org/taxation/housing-taxation-in-oecd-countries_03dfe007-en
Pomeroy S, (2021) “Exploring causes of escalating home prices: Part 2, demand issues,” Canadian Housing Evidence Collaborative Featured Research. Available: https://chec-ccrl.ca/exploring-causes-of-escalating-home-prices-part-2-demand-issues/
Pomeroy S, (2023) “Examining the causes of escalating home prices in Canada,” Housing Finance International Journal, Summer 2023, pp. 30-37.
Ronald R & Kadi J, (2018) “The Revival of Private Landlords in Britain’s Post-Homeownership Society,” New Political Economy, 23(6), pp. 786-803.
Ryan-Collins J, (2021) “Breaking the housing–finance cycle: macroeconomic policy reforms for more affordable homes,” Environment and Planning A: Economy and Space, 53, pp. 480–502.
Ryan-Collins J, Lloyd T, Macfarlane L, (2017) Rethinking the Economics of Land and Housing, Zed Books: London.
Ryan-Collins J & Murray C, (2021) “When homes earn more than jobs: The rentierization of the Australian housing market,” Housing Studies, 38(10), pp. 1888-1917.
Schwartz H & Seabrooke L, (2008) “Varieties of residential capitalism in the international political economy: Old welfare states and the new politics of housing,” Comparative European Politics, 6, pp. 237–261.
Smith S, Clark W, Ong R, Vifor J, Wood G, Lisowski W, Khuong Truong N, (2022) “Housing and economic inequality in the long run: The retreat of owner occupation,” Economy and Society, 51(2), pp. 161-186.
Statistics Canada, (October 2023) “Canadian Housing Statistics Program: Real estate investors, 2021,” Statistics Canada. Available: https://www150.statcan.gc.ca/n1/daily-quotidien/231018/dq231018b-eng.htm
Statistics Canada, (April 2022) “Canadian Housing Statistics Program, 2019 and 2020,” Statistics Canada. Available: https://www150.statcan.gc.ca/n1/daily-quotidien/220412/dq220412a-eng.htm
Schwartz H & Seabrooke L, (2008) “Varieties of residential capitalism in the international political economy: Old welfare states and the new politics of housing,” Comparative European Politics, 6, pp. 237–261.
Smith S, Clark W, Ong R, Vifor J, Wood G, Lisowski W, Khuong Truong N, (2022) “Housing and economic inequality in the long run: The retreat of owner occupation,” Economy and Society, 51(2), pp. 161-186.
Torrado J, Duque-Calvache R, Palomares-Linares I, (2020) “The demand-side determinants of multiple property ownership in Spain,” International Journal of Housing Policy, 20(1), pp. 120–143.
Turner A, (2016) Between Debt and the Devil: Money, credit, and fixing global finance, Princeton University Press: Princeton.
Walks A, (2014) “Canada’s housing bubble story: mortgage securitization, the state, and the global financial crisis,” International Journal of Urban and Regional Research, 38, pp. 256–284
Walks A & Clifford B, (2016) “The Political Economy of Mortgage Securitization and the Neoliberalization of Housing Policy in Canada,” Environment and Planning A, 47, pp. 1624–42
Walks A & Simone D (2016) “Neoliberalization through Housing Finance, the Displacement of Risk, and Canadian Housing Policy: Challenging Minsky’s Financial Instability Hypothesis,” Research in Political Economy, 31, pp. 49–77
Whitzman C, (November 2023) “A Human Rights-Based Calculation of Canada’s Housing Supply Shortages,: submission to the Canadian Human Rights Commission. Available: https://www.homelesshub.ca/sites/default/files/attachments/Whitzman-Human_Rights_Based_Supply_Report-EN_1.pdf
Wind B, Dewilde C, Doling J, (2020) “Secondary property ownership in Europe: contributing to asset-based welfare strategies and the ‘really big trade-off’,” International Journal of Housing Policy, 20(1), pp. 25-52
Wolf M, (2023) The Crisis of Democratic Capitalism, Penguin Press: New York
Wood J & Stockhammer E, (2023) “Bringing Household Finance Back In: House Prices and the Missing Macroeconomics of Comparative Political,” Economy, Politics, & Society, 0(0) online first: https://doi.org/10.1177/0032329223120148
Younglai R, (Sept 8, 2023) “Investors account for 30 per cent of home buying in Canada, data show,” The Globe and Mail. Available: https://www.theglobeandmail.com/business/article-investors-account-for-30-per-cent-of-home-buying-in-canada-data-show
Issue No. 1 – Spring 2024
-
Editorial — Spring 2024
This initial release of the Perspectives Journal sets up the arena for debate among the progressive left of ideas and their applications for a more equal and just Canada.
-
Indigenous Citizenship and Civil Society: An Intervention
There is no pan-Indigenous legal order and no pan-Indigenous response to questions of Indigenous citizenship. The determination of these questions must always be according to a specific legal order, laws, and legal process.

-
Bank of Canada Independence Vs. Accountability
The origin of the concept of central bank independence is a critique of social democratic ideas prevalent during the middle part of Friedman’s career.